
Monitoring of lung function in acute respiratory distress syndrome
The purpose of lung ventilation is providing adequate gas exchange without inducing further injuries to the lungs and other organs. Exhaled gas and blood gas analysis monitor gas exchange, whereas lung mechanics (pressures, volumes and flow) and lung imaging enable the clinician to make sure they provide with lung protective ventilation as much as possible.
However, there are no definite safe levels of PaO2 and PaCO2. Therefore, the patient’s physiological reserve and tolerance to hypoxemia and hypercapnia have to be taken into account when deciding the individually acceptable PaO2 and PCO2, and these acceptable levels could change during the disease process.
On the other hand, there is evidence that low tidal volumes (VT) (1), and low driving (DP) (2), and end-inspiratory plateau (EIP) (1) pressures improve outcome. The exact levels of pressures and volumes that are safe have been discussed and depend probably importantly on the underlying pulmonary condition (3). In this context, DP (= end-inspiratory pressure minus EIP both at zero flow) has the advantage to take into consideration lung compliance that is related to the effective size of aerated lung at the end of expiration [DP = VT divided by compliance and thus, DP PnVT divided by effective end-expiratory lung volume (EELV)] (4,5). Therefore, this gives some rationale for the driving pressure to be the most important respiratory variable to monitor in acute respiratory distress syndrome (ARDS) (2).
In this review we will focus on gas exchange and lung mechanics monitoring during invasive mechanical ventilation for ARDS. We will briefly conclude with lung imaging monitoring because a specific chapter is dedicated to this in this special issue.
Gas exchange
The primary function of the lungs is alveolar ventilation, which provides O2 to and removes CO2 from the tissues. Typically, every minute about 250 mL O2 are delivered to the pulmonary vein and about 200 mL CO2 are removed from the mixed venous blood resulting in a respiratory quote (exchange rate) of 0.8 (6). The relationship between alveolar content in O2 and CO2 is expressed by using the simple gas alveolar equation:

where PAO2 is oxygen partial alveolar pressure, FiO2 oxygen fraction in air, PH2O water vapor partial pressure and PACO2 carbon dioxide partial alveolar pressure. PACO2 is estimated from PaCO2 based on the equilibrium between end-capillary and alveoli gas composition in normal subjects, an assumption not fully valid in lung diseases.
Monitoring of oxygenation
FiO2 is usually monitored by the ventilator to ascertain that adequate concentration of O2 is delivered to the patient, and the patient’s oxygenation status is then assured by pulse oximetry or by frequent blood gas analyses.
The O2− hemoglobin saturation can quite well be estimated by continuous measurement of pulse oxymetric saturation (SpO2). However, the drawback is that it could be an important discrepancy between the blood O2 saturation (SaO2) and SpO2 and that the measurement has a low accuracy at lower SaO2. Furthermore, a prerequisite is that the patient has an adequate peripheral perfusion.
PaO2 might be continuously monitored. Unfortunately, the required transducers have to be inserted in an artery and are difficult to maintain due to clotting around the catheter tip as well as measurement drift. Therefore, hitherto it is seldom used in the ICU. Henceforth, the most common oxygenation monitoring requires frequent arterial blood samples and PaO2 measurement via a blood gas analyzer. When interpreting a blood gas result it is important to consider that PaO2 is not the same as tissue oxygenation and furthermore, oxygenation, perfusion and metabolism are highly different in different organs and tissues. To overcome this, near infrared sensors (NIRS) device can be used for measurement as an example, of muscle oxygenation (on the thenar muscle) or brain oxygenation (with the sensor applied on the temporal bone) (6). However, it is still a question how well these devices reflect tissue oxygenation (and if so, only locally in one tissue or organ) and still no conclusive data exists whether adjusting the management of the patient using NIRS improves outcome.
There are no studies that have investigated the level of the lowest acceptable PaO2. A large number of patients have been enrolled in the ARDSNet trials where the target oxygenation window was 55–80 mmHg. However, PaO2 levels <60 mmHg has been found associated with cognitive impairment in one study (7). Therefore, PaO2 >60 mmHg has been suggested being adequate, but this value needs to be assessed in connection with the patient’s cardiac reserve (cardiac output), hemoglobin level as well as metabolic demand. Indeed, the oxygen transport (DaO2) to the tissues is given by:

and
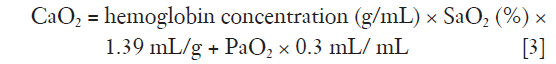
where CO is cardiac output and CaO2 oxygen content.
Thus, the exact level of tolerable PaO2 must be individualized. However, on the other hand, high PaO2 should probably be avoided, except in some circumstances, e.g., severe acute anemia or carbon monoxide intoxication. Notably, a pilot trial found a conservative oxygenation target (SpO2 88–92%) feasible in a non-selected population of critically ill patients (8).
A low PaO2 is caused by low FiO2, intrapulmonary or intra-cardiac shunt, or ventilation/perfusion (V/Q) mismatch. High metabolic rate or too low cardiac output will augment the effects of both shunt and V/Q mismatch (6). To distinguish between shunt and other kinds of V/Q mismatch facing hypoxemia without using Swan Ganz catheter and FiO2 1.0 in the clinical arena in an easy way is to use the Nunn’s shunt diagram showing that if PaO2 is low despite a high FiO2 the main problem is shunt (6).
Shunt is defined as perfusion of non-ventilated lung units, and it is important to consider that high airway pressures, particularly high PEEP when lung collapse cannot be re-expanded due to high opening pressures, could direct the blood flow to the non-ventilated areas, increasing shunt fraction, and the adequate therapy in these circumstances should be decreasing instead of increasing PEEP.
Also, in most conditions mixed venous oxygen partial pressure (PvO2) is more important than PaO2, since it primarily relates to the oxygen tension in the tissues (with the caveat that it reflects a mixture of oxygen tensions in all organs and tissues) (6). The normal value is about 38 mmHg and a value <27 mmHg usually reflects insufficient oxygen delivery to the organs. If so, the other factors in the oxygen delivery and consumption equations should be assessed, i.e., cardiac output, pH (should be <7.4), hemoglobin concentration and metabolism (e.g., body temperature, sedation, shivering) and treated, and not only by increasing FiO2, or by increasing the amount of perfused lung units by PEEP or lung recruitment maneuvers.
Monitoring of Carbon dioxide elimination
CO2 elimination from the lungs is proportional to alveolar ventilation.

where  > is alveolar ventilation, VT tidal volume, and VDphysio physiologic dead space. This latter is equal to:

where VDalv alveolar dead space, VDanat is anatomical dead space due to airway and VDapparatus anatomical dead due to any apparatus located between mouth/tip of the endotracheal tube and the Y piece of the ventilator circuit or leak in invasive or non-invasive mechanical ventilation, respectively (6).
It should be noted that the main part of CO2 in the blood is transported as bicarbonate (80%) and only a minor part is dissolved in the blood (5–10%) (6). The rest is bound to hemoglobin and other proteins. When oxygen is released from the hemoglobin in tissues more CO2 molecules will bind to the hemoglobin and in the lungs CO2 will be released from when O2 binds to hemoglobin (Haldane effect) (6).
Pulmonary CO2 elimination can be monitored by volumetric exhaled CO2 measurement (the CO2 signal is integrated with the expired flow) using in-line (preferentially) or side stream infrared CO2 analysis (9-11). It will give end-tidal CO2, VDanat and an estimate of VDalv ; with the use of arterial blood gases it is possible to calculate VDphysio (6). In addition, the CO2 curve will also give information of spontaneous breathing efforts (9).
The Bohr dead space ( Bohr) is calculated as:
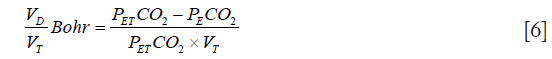
where PETCO2end-tidal PCO2 and  mixed expired PCO2 (10,11). Enghoff modified this equation by replacing end-tidal PCO2 with PaCO2 (10,11). Note that the “Enghoff” dead space is increased in conditions with increased pulmonary increased pulmonary shunt. Dead space measurement is useful for assessing prognosis and for evaluating the effect of prone positioning as well as PEEP titration.
Thus, a high Enghoff VD/VT (as a sign of severe lung collapse/consolidation) in ARDS is associated with poor prognosis, and a reduced VD/VT by prone position (reducing shunt by recruitment of previously collapsed lung units) indicates a good prognosis.
CO2 elimination is dependent on both the pulmonary circulation and the pulmonary ventilation as well the CO2 production (i.e., metabolism). Thus, a sudden decrease in CO2 excretion at stable ventilation is always due to a sudden decrease in pulmonary perfusion, e.g., pulmonary emboli or a reduction in cardiac output (shock or cardiac arrest) (10). Likewise, a decrease in CO2 excretion with no change in circulation is due deteriorated ventilation, e.g., at pressure controlled ventilation reduced compliance (secretions edema or lung collapse) or increased airway obstruction by secretion (10).
PaCO2 is obtained from ordinary blood gas analyzer and has to be interpreted in relation to alveolar ventilation, arterial pH, and, as mentioned before, pulmonary circulation and CO2 production.
As a rule, ventilation should be adjusted to achieve a normal or slightly acidotic pH (7.2–7.4) and pH should not allowed to be >7.4 except in specific circumstances, e.g., acute increased intracranial pressure or perhaps acute pulmonary hypertension (12). Thus, a high pH constricts coronary arterial and intracranial vessels that might reduce perfusion to both heart and the brain. In contrast, a low pH, i.e., a high PaCO2, improves peripheral oxygen delivery by its effect on oxygen-hemoglobin dissociation curve. However, it could increase pulmonary arterial vasoconstriction and thus pulmonary vascular impedance. In addition, a high PaCO2 affects the immune system with both positive and negative effects (13).
Ventilatory adjustments when PaCO2 reduces pH to unacceptable levels include reducing apparatus dead space (e.g., if a heat and moisture exchanger in used, removing and replacing it by a heated humidifier), increasing minute ventilation, increasing end-inspiratory pause, which, due to longer time allowed for gas diffusion, will move the diffusion—convection interface in the airways to a proximal position and thus cause a decrease in airway dead space and an improvement in CO2 elimination (14).
Monitoring lung mechanics
Most variables necessary for adequate monitoring can be obtained from modern ICU ventilators. Thus, it is possible to monitor on the ventilator screen inspiratory and expiratory pressures during flow and no-flow conditions, inspiratory and expiratory gas flow rate and tidal volumes. Some ventilators have the option to measure esophageal pressure (Pes), pressure volume loops during low flow conditions as well as EELV and some derivatives from the measurements, e.g., quasi-static and dynamic compliance, inspiratory resistance and stress index (SI) (see below).
The mechanics of the respiratory system are dependent on the airway pressure, the pleural pressure, the flow rate, the lung volume, the tidal volume and the condition of the lungs and chest wall. Therefore, the local strain (lung tissue deformation or volume change) and the transpulmonary pressure (airway pressure-pleural pressure) are different in different locations in a heterogeneous lung, such as in ARDS (15,16). It is also important to note that the results, not only depends on the condition of the respiratory system but also on the patient position.
The lung mechanics are defined as the forces (i.e., pressures) needed to inflate an amount of gas into the lungs and include two components: (I) the force needed to overcome the resistance to airflow in the endotracheal tube and in the airways (flow-resistive pressure); and (II) the force needed to overcome the elastic properties of the lungs and the chest wall (elastic recoil pressure) (6).
Normally during invasive ventilation about 70% of the force needed to overcome resistance is due to endotracheal tube impedance and almost all of resistive force has dissipated as heat before the inspired gas reaches the bronchioles and alveoli. Therefore, the inspiratory flow rate has minimal influence on alveolar stress and strain and thus, ventilator-induced lung injury (VILI). Although it is possible to estimate flow resistance, it is important to consider that resistance is dependent on the flow rate, that inspiratory resistance is different from expiratory resistance, and that resistance depends not only on the patient’s airways but also to a variable extent on the endotracheal tube resistance. Two easy monitoring methods that give hints of whether resistance is high or low are: (I) computation of inspiratory resistance under a constant inspiratory flow as peak airway pressure minus EIP /inspiratory flow rate; and (II) assessment whether the flow has ceased at end-inspiration (during pressure controlled ventilation) or at end-expiration. If it has not, this is due to a time constant of the respiratory system (resistance × compliance) that is too long relative to inspiratory and expiratory time, respectively, resulting from ventilator settings. In ARDS this is due to a high resistance or too short expiratory time. This latter has been used to induce auto-PEEP in order to keep the lungs open (inverse ratio ventilation). However, this method keeps only the lung regions with long time constants open, but not the fast lung units, which collapse easily, in contrast to adequately high set extrinsic PEEP.
The elastance of the respiratory system (Ers) is calculated as ΔPaw/ΔV where ΔPaw equals the airway pressure difference between two no-flow conditions, i.e., during mechanical ventilation EIP and PEEP, and ΔV is the VT. EIP should be obtained after a short end-inspiratory pause and initial part that best reflects the maximum pressure the alveoli are subjected to (17). Since the flow into the lung is not zero, due to pendelluft and viscoelastic relaxation, the obtained Ers is termed as “quasi-static”. Compliance of the respiratory system (Crs) is defined as the inverse of Ers, (Crs = 1/Ers). The elastance of the chest wall (Ecw) and the lungs (EL) can be derived if the pleural pressure is estimated from the Pes. Similar as for the total respiratory system, quasi-static elastance of chest wall and lung can be computed as Ecw = ΔPes/ΔV, EL = (ΔPaw − ΔPes)/ΔV. Since Ers = EL + Ecw, it follows that Crs = 1/CL + 1/Ccw.
A more careful method to obtain quasi-static compliance is by slowly or intermittently inflating the lungs by the ventilator or by a super syringe to total lung capacity and then slowly deflate them and simultaneously measure airway and Pes as well as lung volume changes. The pressures are then plotted on the X-axis and the volume on the Y-axis of a graph, obtaining a pressure-volume loop. From this loop both the inspiratory and expiratory compliance can be obtained as the slope of the inspiratory and expiratory limb of the loop, respectively. Note that these compliance values are quite different due to hysteresis and inertia of the chest-wall—abdominal complex (lower compliance is found on the inspiratory than on the expiratory limb) (18). In addition, it shows that the pressures on the expiratory limb are lower than on the inspiratory limb at similar lung volumes, also due to the effect of hysteresis (18). Although a full pressure volume loop can be obtained from some ventilators this method can hardly be considered as an easy monitoring method.
Dynamic compliance is usually calculated as (Peak inspiratory pressure—PEEP)/VT and therefore includes both the resistive and elastic components.
The two most important pressures to monitor are EIP, which reflects alveolar pressure, and DP. EIP should be kept <28–30 cmH2O and DP <14–15 cmH2O. If these pressures increase during ventilation it could be due to reduced compliance (usually new lung collapse or increased edema) or increased auto-PEEP (secretion, biting-kinking of the endotracheal tube). It should be noted that it is the trans-pulmonary pressure, i.e., stress that induces VILI and therefore Pes should be assessed (19). This pressure is usually measured with air-filled balloon catheter in the third part of the esophagus (19). Thus, in conditions with increased chest wall elastance, e.g., abdominal hypertension, chest wall restriction e.g., scoliosis, or when the chest wall pressure volume curve is right shifted as in obesity, transpulmonary pressure, i.e., lung stress, could be less than estimated from airway pressure measurements (15). It has been estimated that the transpulmonary driving pressure should be <11.7 cmH2O, and the maximum stress (transpulmonary pressure) should be <24 cmH2O in order to prevent VILI (20). However, Pes does not always reflect the absolute value of the pleural pressure. In an adult, lung healthy, supine person Pes is usually positive (commonly about 5 cmH2O) at normal end-expiration at atmospheric pressure, but since the transpulmonary pressure in normal expanded lungs must always be positive, pleural pressure has to be negative in this circumstance. The positive value of Pes is probably due to the fact that esophagus is compressed between the mediastinum and the thoracic vertebral bodies (21). Furthermore, compliance of the esophagus and esophageal muscle tone influences the measured Pes. On the other hand, as a rule, a correctly calibrated Pes has considered to give an acceptable estimate of pleural pressure at the gravitational level at which the esophageal balloon is located. However, still, the absolute value of Pes needs to be interpreted cautiously, while relative values are usually reliable. Moreover, although plausible and indicated in one small study, whether ventilation adjusted to trans-pulmonary pressures improves outcome has not been conclusively shown as yet (22).
Physiologically, it is not the volume and/or the pressure per se that cause VILI, but the power delivered to the respiratory system (23). Simply, power could be estimated as DP × VT × respiratory rate, although PEEP also influences the power delivered to the lungs. The total amount of energy is power × time. If the power is above a specific threshold, it will induce VILI by mechanotransduction and the following inflammatory reaction. In our view, the energy might be an even more important factor for VILI since it also includes the duration of the injurious ventilation. Therefore, avoiding inadvertent power and energy transfer to the lungs is another reason to monitor DP and VT and keeping them as low as possible.
Monitoring of adequate PEEP by the use of lung mechanics
An optimal PEEP should be set at an end-expiratory pressure that prevents: (I) expiratory collapse; (II) intra-tidal collapse and re-expansion (recruitment-derecruitment); and (III) end-expiratory and end-inspiratory overdistension. Since the lungs are composed of >300 millions alveoli and in ARDS the lung mechanical properties are very heterogeneous, i.e., lung regions close to each other could have totally different specific lung volumes and compliances (16), a general set PEEP is always a compromise and could never be fully “optimal”. Furthermore, since we commonly use one endotracheal tube for ventilation, we have no other choice than to set a PEEP that affects the entire lung.
Except for lung imaging methods using respiratory mechanics are the most common for PEEP setting. The classical method is the set PEEP using a static pressure—volume curve. PEEP is set at the pressure level where inspiratory compliance increases, which can be disclosed by the so-called “lower inflexion point” (LIP). Ventilation is operating on the steep part of curve, i.e., between LIP and the pressure at the “upper inflexion point” (UIP) at which compliance suddenly decreases, indicating overdistension. However, the most import pressure is the pressure where a substantial amount of lung regions start to collapse, and this pressure is found on the expiratory limb of the pressure volume loop, where compliance is maximal. Without using a pressure volume curve, similar pressure could be estimated with a decremental PEEP trial (i.e., reducing PEEP slowly) after a maximum recruitment is performed (24). This pressure is found at the PEEP level with lowest DP (i.e., highest Crs) and the “optimal” PEEP is set 2 cmH2O above this pressure. One needs to consider that this kind of maneuver is only useful if the lungs can be recruited, i.e., mainly in early ARDS.
SI relates the tidal inspiratory pressure to inspiratory time using a constant inspiratory flow (25). Since at constant flow the time indicates a linear volume increase, SI could be regarded as a tidal volume/pressure curve, i.e., the instant slope of the curve equals Ers if the resistance is constant. Therefore, an increasing slope (SI >1) over time, and hence volume, indicates an increased Ers, i.e., overdistension. Conversely, a decreasing slope (SI <1) indicates a decreasing Ers, e.g., tidal alveolar recruitment, and a straight line (SI =1) a constant Ers (neither recruitment or distension or since the lungs are heterogeneous in ARDS, that equal amounts of lung parenchyma are recruited or over- distended during the same breath). Although physiologically sound, it is not clear whether a PEEP setting in order to achieve a SI =1 will reduce VILI or improve outcome.
EELV
Measurement of EELV is suggested for evaluating whether the lung is collapsed/overdistended and for setting or assessing the effect of PEEP. EELV could be estimated with CT scan, but it is cumbersome and has radiation risk at frequent repeated exposure. Therefore CT cannot be seen as a monitoring routine tool, and particularly for monitoring EELV or its changes, e.g., recruitment, by different kinds of interventions.
Tracer gas dilution techniques are limited in that the closed circuit method requiring patient disconnection from the ventilator can hardly be deemed as monitor technique. In contrast, the open circuit multiple breath nitrogen washin-washout technique that is now incorporated in one ventilator brand is quite easy to handle and gives acceptable estimates of EELV (26). However, one needs to consider that the EELV obtained is solely the gas volume in lungs and if EELV increases with increasing PEEP, it cannot be determined whether the increase in EELV is due to overdistension of open units, an increase in normal lung volume, or a recruitment of previously collapsed lung units or a combination of all.
Monitoring by lung imaging
As mentioned the ARDS lungs are very heterogeneous and with conventional lung mechanics it is not possible to assess the regional differences in lung mechanical properties. For this purposes chest CT and electrical impedance tomography (EIT) are the methods of choice. However, as discussed above, CT is an excellent method for diagnosis and understanding of the underlying deterioration in lung morphology, but too demanding for monitoring (4,5,27). However, initial therapy might be changed according the CT-findings that might improve outcome (27). EIT on the other hand, is more useful for monitoring and evaluating the regional effects of PEEP, recruitment maneuvers and ventilation (28). Another useful method for this purpose is lung ultrasound, that is, in addition, suitable to diagnose lung consolidation and pleural conditions (29). Ordinary plain chest X-ray could be used for diagnosis of ARDS and is useful for assessing the lungs if the pulmonary function deteriorates although better information in these situations are obtained from CT scans.
Lung ultrasound is a bedside method that has been extensively developed during the recent years that is ideal for both diagnosing and intermittent monitoring (29). With a standardized approach it is possible to see pleural syndromes such as pleural fluid, pneumothorax as well as alveolar interstitial syndromes and alveolar consolidation. It may also be used to evaluate PEEP settings and tidal recruitment/derecruitment despite the limitation that it cannot assess overdistension. Furthermore, it is considered to be more reliable method than chest radiography in ARDS (29). Moreover, it is always available, and the measurements could be repeated quickly. In addition, with the same equipment cardiac function could be assessed that is helpful when diagnosing and treating patients with ARDS. It is a relative fast method; a complete examination of the lungs takes about 10 min.
EIT uses electric currents in order to image the changes in air content into the lungs (28). It is a continuous method, where 16 to 32 electrodes are placed separately or on a belt around the circumference of the lower thorax. These electrodes are both transmitters and receptors of small electric currents. Since air/gas has higher impedance than tissue or body fluids this method can evaluate changes in aeration in the thorax during breathing and current methods can obtain 50 images/s (28). Thus, it is possible to evaluate regional—dorsal to ventral—differences in ventilation patterns and furthermore whether new collapse or recruitment occur during ventilation. It may be used to set PEEP level. In addition, by injecting hypertonic saline (that has a low impedance) in a central IV line it is possible to evaluate regional pulmonary perfusion. The drawbacks are that EIT does not assess aeration (only changes in aeration during ventilation), it covers only 2–3 cm frontal- dorsal slice of the lungs and more belts are needed if both the caudal and the cranial region of the lungs should be assessed. Whether using this method for adjusting ventilation improves outcome is not known.
Conclusions
Using information from monitoring of gas exchange, lung mechanics and imaging it is usually possible to prevent VILI and maintain acceptable gas exchange. Particularly we want to point of the development of variables obtained by ventilator and monitored on the ventilator screens, exhaled CO2 analysis and lung ultrasound.
Acknowledgements
The work is supported by the Swedish Heart and Lung foundation and the Swedish Research Council.
Footnote
Conflicts of Interest: The authors have no conflicts of interest to declare.
References
- Acute Respiratory Distress Syndrome Network, Brower RG, Matthay MA, et al. Ventilation with lower tidal volumes as compared with traditional tidal volumes for acute lung injury and the acute respiratory distress syndrome. N Engl J Med 2000;342:1301-8. [Crossref] [PubMed]
- Amato MB, Meade MO, Slutsky AS, et al. Driving pressure and survival in the acute respiratory distress syndrome. N Engl J Med 2015;372:747-55. [Crossref] [PubMed]
- Terragni PP, Rosboch G, Tealdi A, et al. Tidal hyperinflation during low tidal volume ventilation in acute respiratory distress syndrome. Am J Respir Crit Care Med 2007;175:160-6. [Crossref] [PubMed]
- Gattinoni L, Pesenti A, Baglioni S, et al. Inflammatory pulmonary edema and positive end-expiratory pressure: correlations between imaging and physiologic studies. J Thorac Imaging 1988;3:59-64. [Crossref] [PubMed]
- Gattinoni L, Pesenti A. The concept of "baby lung". Intensive Care Med 2005;31:776-84. [Crossref] [PubMed]
- Lumb AB, Pearl RG. Nunn’s Applied Respiratory Physiology. 6th edition. Philadelphia: Elsevier Limited, 2005.
- Mikkelsen ME, Christie JD, Lanken PN, et al. The adult respiratory distress syndrome cognitive outcomes study: long-term neuropsychological function in survivors of acute lung injury. Am J Respir Crit Care Med 2012;185:1307-15. [Crossref] [PubMed]
- Panwar R, Hardie M, Bellomo R, et al. Conservative versus Liberal Oxygenation Targets for Mechanically Ventilated Patients. A Pilot Multicenter Randomized Controlled Trial. Am J Respir Crit Care Med 2016;193:43-51. [Crossref] [PubMed]
- Bhavani-Shankar K, Moseley H, Kumar AY, et al. Capnometry and anaesthesia. Can J Anaesth 1992;39:617-32. [Crossref] [PubMed]
- Olsson SG, Fletcher R, Jonson B, et al. Clinical studies of gas exchange during ventilatory support--a method using the Siemens-Elema CO2 analyzer. Br J Anaesth 1980;52:491-9. [Crossref] [PubMed]
- Suarez-Sipmann F, Bohm SH, Tusman G. Volumetric capnography: the time has come. Curr Opin Crit Care 2014;20:333-9. [Crossref] [PubMed]
- Vieillard-Baron A, Matthay M, Teboul JL, et al. Experts' opinion on management of hemodynamics in ARDS patients: focus on the effects of mechanical ventilation. Intensive Care Med 2016;42:739-49. [Crossref] [PubMed]
- Curley GF, Laffey JG. Acidosis in the critically ill - balancing risks and benefits to optimize outcome. Crit Care 2014;18:129. [Crossref] [PubMed]
- Sturesson LW, Malmkvist G, Allvin S, et al. An appropriate inspiratory flow pattern can enhance CO2 exchange, facilitating protective ventilation of healthy lungs. Br J Anaesth 2016;117:243-9. [Crossref] [PubMed]
- Chiumello D, Carlesso E, Cadringher P, et al. Lung stress and strain during mechanical ventilation for acute respiratory distress syndrome. Am J Respir Crit Care Med 2008;178:346-55. [Crossref] [PubMed]
- Perchiazzi G, Rylander C, Derosa S, et al. Regional distribution of lung compliance by image analysis of computed tomograms. Respir Physiol Neurobiol 2014;201:60-70. [Crossref] [PubMed]
- Henderson WR, Chen L, Amato MB, et al. Fifty Years of Research in ARDS. Respiratory Mechanics in Acute Respiratory Distress Syndrome. Am J Respir Crit Care Med 2017. [Epub ahead of print]. [Crossref] [PubMed]
- Koefoed-Nielsen J, Nielsen ND, Kjaergaard AJ, et al. Alveolar recruitment can be predicted from airway pressure-lung volume loops: an experimental study in a porcine acute lung injury model. Crit Care 2008;12:R7. [Crossref] [PubMed]
- Akoumianaki E, Maggiore SM, Valenza F, et al. The application of esophageal pressure measurement in patients with respiratory failure. Am J Respir Crit Care Med 2014;189:520-31. [Crossref] [PubMed]
- Chiumello D, Carlesso E, Brioni M, et al. Airway driving pressure and lung stress in ARDS patients. Crit Care 2016;20:276. [Crossref] [PubMed]
- Hedenstierna G. Esophageal pressure: benefit and limitations. Minerva Anestesiol 2012;78:959-66. [PubMed]
- Talmor D, Sarge T, Malhotra A, et al. Mechanical ventilation guided by esophageal pressure in acute lung injury. N Engl J Med 2008;359:2095-104. [Crossref] [PubMed]
- Gattinoni L, Tonetti T, Cressoni M, et al. Ventilator-related causes of lung injury: the mechanical power. Intensive Care Med 2016;42:1567-75. [Crossref] [PubMed]
- Suarez-Sipmann F, Böhm SH, Tusman G, et al. Use of dynamic compliance for open lung positive end-expiratory pressure titration in an experimental study. Crit Care Med 2007;35:214-21. [Crossref] [PubMed]
- Ranieri VM, Zhang H, Mascia L, et al. Pressure-time curve predicts minimally injurious ventilatory strategy in an isolated rat lung model. Anesthesiology 2000;93:1320-8. [Crossref] [PubMed]
- Dellamonica J, Lerolle N, Sargentini C, et al. Accuracy and precision of end-expiratory lung-volume measurements by automated nitrogen washout/washin technique in patients with acute respiratory distress syndrome. Crit Care 2011;15:R294. [Crossref] [PubMed]
- Simon M, Braune S, Laqmani A, et al. Value of Computed Tomography of the Chest in Subjects With ARDS: A Retrospective Observational Study. Respir Care 2016;61:316-23. [Crossref] [PubMed]
- Frerichs I, Amato MB, van Kaam AH, et al. Chest electrical impedance tomography examination, data analysis, terminology, clinical use and recommendations: consensus statement of the TRanslational EIT developmeNt stuDy group. Thorax 2017;72:83-93. [Crossref] [PubMed]
- Lichtenstein D, Goldstein I, Mourgeon E, et al. Comparative diagnostic performances of auscultation, chest radiography, and lung ultrasonography in acute respiratory distress syndrome. Anesthesiology 2004;100:9-15. [Crossref] [PubMed]

