
Theoretical models for the simulation of particle deposition and tracheobronchial clearance in lungs of patients with chronic bronchitis
Introduction: Based upon theoretical models particle deposition and clearance in human respiratory systems affected by chronic bronchitis can be approximated reliably. As a consequence of those hypothetical results, optimal frame conditions (e.g., inhalation time and volume, particle properties) for inhalation therapies can be determined.
Methods: Simulation of particle deposition was conducted by modelling a partly or fully obstructed tracheobronchial architecture. Bronchitis-induced reductions of the airway calibres were computed by application of specific scaling factors. Three different scenarios of chronic bronchitis were modelled. Brownian motion, inertial impaction, interception, and gravitational settling were assumed as main deposition forces influencing inhaled particular mass. Tracheobronchial clearance was approximated by application of generation-specific mucus velocities as well as the consideration of a slow bronchial clearance phase, whose half-time varied between 5 and 20 days.
Results: Under different breathing conditions (i.e., sitting and light-work breathing) deposition of submicron and μm-sized particles is significantly enhanced within the bronchial lung region, but also alveolar deposition becomes partly enhanced. By changing the inhalation conditions target sites of therapeutic aerosols may be reached with rather high accuracy. Based on the data of this modified models, particle retention in lung airways of patients suffering from chronic bronchitis may be noticeably prolonged, with 24-hour retention values being increased by up to 50%.
Discussion and conclusions: As exhibited by the results, particle deposition behaviour in lungs affected by chronic bronchitis differs remarkably from that in healthy lungs. These theoretical finds are mostly supported by experimental data. Further, experimental and theoretical deposition results may be used for an estimation of the grade of disease. Tracheobronchial clearance reduces its efficiency with each progress of the disease which increases the probability of bacterial infections in the airways.
Key words: Stochastic lung model; particle deposition; bronchial clearance; chronic bronchitis
Introduction
Chronic bronchitis respresents a chronic obstructive pulmonary disease (COPD) and may be characterized by the progressive development of airflow limitations which are not fully reversible (1-3). Besides bronchitis the term COPD also encompasses emphysema, being marked by the enlargement of airspaces distal to the terminal bronchioles, the successive destruction of the lung parenchyma, the loss of lung elasticity, and, finally, the closure of small airways (1,4). An additional feature leading to the exacerbation of COPD is the formation of local mucous plugs in small airways due to the hypersecretion of mucous liquid. Typical patients suffering from COPD show all three pathological conditions, i.e., chronic bronchitis, emphysema, and mucus plugging, whereby the relative extent of bronchitis and emphysema may significantly vary from subject to subject (1) (Figure 1).

Chronic bronchitis sensu stricto is commonly defined by the presence of a productive cough with a duration of more than three months in two consecutive years (5). The cough is due to the hypersecretion of mucus, which itself results from a continuous mucus gland enlargement, representing the histologic hallmark of chronic bronchitis (6). The disease is further characterized by multiple structural modifications within the airways, including, among other, atrophy, focal squamous metaplasia, abnormalities of epithelial cilia, inflammation and bronchial wall thickening. The last symptom is primarily caused by the formation of edema as well as the accumulation of neutrophilic infiltrates in the submucosa (2). Most remarkable changes have to be attested for the respiratory bronchioles, where mononuclear inflammatory processes, goblet cell metaplasia, smooth muscle hyperplasia, and distortion due to fibrosis can be recognized (3). Based upon these dramatic symptoms, it is not further astonishing that COPD represents now the fourth leading cause of death in the United States, but the only common cause of death, which is continuously increasing in incidence (1).
Modern treatment of COPD includes drug therapies, the administration of corticosteroids, nonpharmacological methods, and the application of new medicals such as mediator antagonists, protease inhibitors or innovative antiinflammatory drugs (1,7-11). Although COPD therapy has made considerable progresses during the past decades, only cessation of smoking, representing the primary cause of the disease, leads to a measureable slowing of the progression of COPD (12). Main medical substances administered by conventional drug therapy are bronchodilators, causing an increase of the FEV1 (12,13), antibiotics, being appropriate countermeasures against bacterial infection, and oxygen, which is used for the treatment of patients with severe COPD and chronic hypoxemia. Corticosteroids are widely prescribed for patients with COPD, although, according to present medical knowledge, inflammation accompanying the disease is not suppressed by the inhalation or oral administration of these medicals (14,15). On the other side, systemic corticosteroids may have an beneficial effect in the treatment of acute exacerbations of COPD (16,17), making them indispensible in this context.
Since most drugs are aerosolized and targeted to the diseased sites of the lungs by inhalation procedures, exact knowledge of the transport and deposition behaviour of liquid or solid particles in the human respiratory system are of immense significance. Concerning this important question within the therapy of COPD patients, theoretical models may provide an essential contribution, finally leading to an optimization of drug delivery through the tracheobronchial compartment. Inflammation processes due to bacterial infection, which frequently occur in bronchitis patients and COPD patients in general, have to be regarded as a remarkable result of malfunctions regarding the clearance of any particular substances deposited in the airway tubes. In this case, respective mathematical models may simulate the successive exacerbation of fast and slow clearance mechanisms and may help to understand principle processes influencing the particle evacuation system in diseased lungs.
Methods - the oretical approaches to the particle behavior in lungs with chronic bronchitis
Simulation of particle deposition scenarios
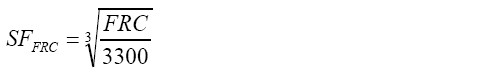
Airway scaling: in correspondence with previously published models, the modified lung architecture of bronchitis patients was obtained by a specific scaling procedure of the tracheobronchial tree that depended upon the functional residual capacity (FRC) as well as the airway resistance (Raw) of the diseased lungs. Airway calibration based on the FRC was conducted by using a uniform scaling factor (SFFRC) for the whole bronchial network, whose calculation took place according to the following formula (18,19):
 [1]
[1]In equation [1], FRC denotes the functional residual capacity of a respiratory system affected by chronic bronchitis, whilst the value of 3,300 mL represents the functional residual capacity of an average healthy lung (19,20). Hence, an FRC greater than 3,300 mL results in a respective scaling factor that exceeds 1, whereas an FRC smaller than 3,300 mL results in a scaling factor that is lower than 1. Measurements of the FRC of COPD patients were obtained from the study of Kim and Kang (21), who experimentally investigated the deposition of 1 µm di-2-ethylhexyl sebacate oil aerosols in the lungs of 10 patients exhibiting different degrees of the lung insufficiency.
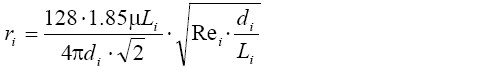
Since the Raw value, which represents an indicator of total airway resistance, increases with the exacerbation grade of chronic bronchitis, it may be used as an appropriate tool to determine the diameter reduction in the air-conducting zone of the respiratory system [airway generations 0-16 sensu ICRP (20)]. Generally, the resistance, ri, in a given airway of generation i may be derived from the simplified formula (22)
 [2]
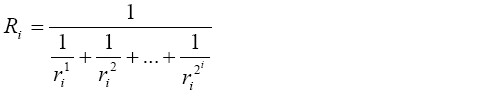
[2]with di, Li, Rei, and µ, respectively, denoting the airway diameter, the airway length, the Reynolds number, and the viscosity of air. The equation assumes a fully symmetric lung structure with identical airway dimensions in a given generation of the lung. To account for a more realistic, i.e., stochastic, lung architecture, di and Li were randomly selected from respective probability density functions calculated for each generation of the tracheobronchial network (23). According to Kim et al. (24), all airways belonging to the same lung generation may be regarded as resistors in parallel, so that in the ideal case of the deterministic lung the total resistance in generation i, Ri, is obtained from the equation:
 [3]
[3]In the more complex case of the stochastic lung, Ri was computed based on the formula
 [4]
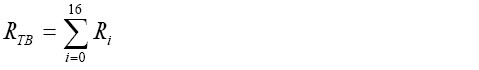
[4]where ri1…ri2^i are the resistances in the individual airways of lung generation i. The resistance of the entire tracheobronchial tree, RTB, was calculated by regarding the single generations of the lung as resistors in series, for what reason this essential parameter is equal to the sum of the resistance in each airway generation:
 [5]
[5]The scaling procedure sensu stricto was carried out by using an iterative algorithm. After calculation of the mean Raw of ten patients (21), the FRC-calibrated stochastic model of the tracheobronchial network was randomly scaled within a physiologically meaningful range. For the scaled lung RTB was computed according the equations [2]-[5]: if RTB was smaller than Raw, respective scaling factors were further decreased, and calculations were conducted once more. If, on the other hand, RTB was greater than Raw, scaling factors were slightly increased, and computations were repeated. In the concrete case, four different airway calibration scenarios were applied: in case 1, the whole tracheobronchial tree was subject to a uniform scaling, whilst in case 2 the airway network was subdivided into the two anatomical regions BB (bronchial) and bb (bronchiolar) (20), whereby BB airways were categorized by (uncalibrated) diameters >0.34 cm and bb airways by diameters ≤0.34 cm. Within the two compartments different scaling strategies were applied. In case 3, scaling was limited to single lung lobes.
Deposition model: the stochastic deposition model used for the computations was introduced and described in detail by Koblinger and Hofmann (25), for what reason only the most salient features of the approach will be subject to a brief elucidation. Generally, the mathematical model is founded on a so-called random walk algorithm, where single particle trajectories run along a randomly selected path through the tracheobronchial and acinar regions. The generation of a large number (e.g., 10,000) of such particle trajectories, which is necessary for statistical reasons, was realized by application of the Monte Carlo simulation technique. To obtain realistic deposition scenarios, morphometric data of the tracheobronchial tree (26) as well as data of the acinar morphology (27) were included into the stochastic model. In order to utilize these huge amounts of published morphometric data for modelling, they were subject to extensive statistical analyses, thereby deriving reliable probability density functions for the distributions of diameters, lengths, branching, and gravity angles (23,25). For simulation of the random path of an inhaled particle through the stochastic airway system, at each branching site linear generation-specific airway dimensions are selected from probability density functions by a pseudo-random number generator, considering also potential correlations between the morphometric parameters themselves.
In the stochastic deposition model three main particle deposition forces, namely inertial impaction, interception, gravitational settling, and Brownian diffusion, are distinguished (26-28). For each airway tube an individual deposition probability is computed which in the case of inertial impaction results from the formula (29)
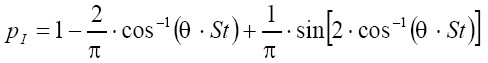 [6]
[6]where θ is the half branching angle of two daughter airways within an airway bifurcation and St is the Stokes number. Eq. [8] is only valid for St <1, while for St ≥1 pI commonly amounts to 1. Interception is expressed by airway generation-specific enhancement factors. Deposition probability due to gravitational settling is given by
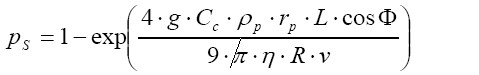 [7]
[7]with g, rp, Ф, and v, respectively, representing the gravitational constant (9.87 m∙s-2), the radius of the particle of interest, the angle of a given airway tube axis relative to the direction of gravity, and the flow velocity in the airway tube. Deposition probability caused by Brownian diffusion is defined by the formula:
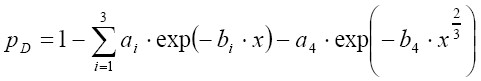 [8]
[8]In Eq. [10] ai and bi are empirical coefficients (21), whilst x is defined as follows:
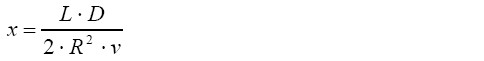 [9]
[9]D denotes the diffusion coefficient which is calculated for the fluid and temperature of interest according to the well known Einstein equation. Assuming a total number of 100,000 particles, whose trajectories are simulated by the model, the amount of particles deposited in the bronchial airway j is obtained according to the following considerations:
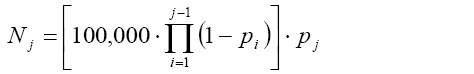 [10]
[10]In the formula noted above pi and pj include the deposition probabilities for inertial impaction, gravitational settling, and Brownian diffusion which were introduced in equation [6]-[8].
Simulation of particle clearance
Formulation of the model: simulation of clearance in lungs affected by chronic bronchitis was conducted by using the basic mathematical approach introduced by Sturm et al. (30), Hofmann & Sturm (31), and Asgharian et al. (32). Within this model, computation of tracheobronchial mucus velocities is mainly based upon the assumptions that: (I) the thickness of the mucus layer is constant throughout the airway network, (II) the mucus layer is moved with a constant (effective) velocity through a given airway, (III) the mucus production rates are constant in the terminal bronchioles, (IV) the dimension of the mucus layer is small compared to that of the respective airway. Within a given airway bifurcation consisting of a parental and two daughter tubes the mucus volume is subject to a conservation, so that under steady-state, steady-flow conditions the following equation is fulfilled (32):
 [11]
[11]with QP denoting the mucus volume flow rate in the parental airway and QD1 as well as QD2 the respective flow rates in the daughter tubes. In general, the mucus volume flow rate in a specific airway corresponds to the mucus volume divided by the residence time of the liquid layer in that bronchial tube. The volume of the mucus layer (constant thickness x) in an arbitrary airway tube k with the diameter dk and the length lk is given by the formula:
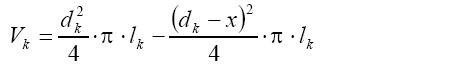 [12]
[12]By combining equation [11] with equation [12] and additionally expressing residence time in terms of airway length and mucus velocity, the following important expression is obtained:
 [13]
[13]where v and d denote the net mucus velocity and the airway diameter, respectively. Since mucus velocities are equal in all terminal bronchioles (vT), the simplified formula of the form
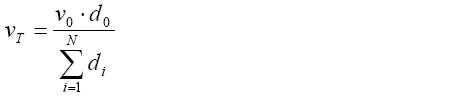 [14]
[14]is obtained (32), within which v0 represents the experimentally derived mucus velocity in the trachea, whilst d0 is the tracheal diameter, di the diameter of the i-th terminal airway, and N the total number of terminal bronchioles. After computation of mucus velocity in the terminal airways according to equation [14], mucus velocities in any preceding airways can be derived from equation [13]. Calculations are carried out for all the airways of the tracheobronchial tree, until the trachea is reached. Once the mucus velocities in all the airway tubes of the tracheobronchial tree are calculated, residence time, tr, of particulate mass in an airway may be obtained from the following formula:
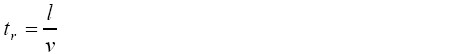 [15]
[15]where l is again the length of the bronchial tube {see equation [12]}.
In patients with chronic bronchitis hypersecretion of mucus has an indifferent effect on mucociliary clearance in an early phase of the disease, and according to equations [11] to [13] enhancement of the mucus volume does not influence mucus velocity. With progressive course of the disease changes of the epithelial structure including the disintegration of mucus-transporting cilia lead to a continuous reduction of mucociliary clearance efficiency. This phenomenon is further supported by a successive change of the consistency of the mucus due to the incorporation of e.g., cellular fragments (20,33). In the exemplary case presented here, mucus velocity reduction was subject to a stochastic variation ranging from 0 to 50%, thereby considering different grades of chronic bronchitis.
For the construction of clearance graphs the mass retained in the tracheobronchial tree at time t divided by the particulate mass initially deposited in the respiratory tract is plotted against time. The overall mass retained in the tracheobronchial region is simply obtained by summing up the retained masses in each airway of the bronchial network. Within a single airway, the particle mass balance is given by the equation (32):
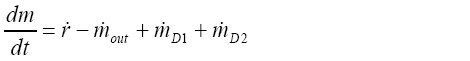 [16]
[16]with m denoting the mass retained in the given airway, and  representing the respective bronchial deposition rate. The factors
  and
and  are the mass rates entering the airway of interest after leaving its daughter branches, whilst
  is the mass rate leaving the airway itself. This latter parameter may be derived from the simple formula:
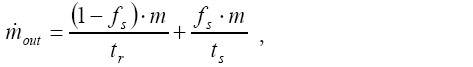 [17]
[17]where fs is the so-called slow clearance fraction and ts is the time required for the single slow clearance processes. Based on shallow bolus inhalation experiments fs may be expressed by a linear mathematical relationship of the following form (30,31):
 [18]
[18]with dg representing the geometric diameter of the particles deposited in the tracheobronchial airways. By convention half-time of slow clearance was stochastically varied between 5 and 20 days (20,30,31). By using the mathematical technique of small time increments ∆t, equation [16] can be solved independently for each airway. Solution of the differential equation according to the variation-of-constants method yields:
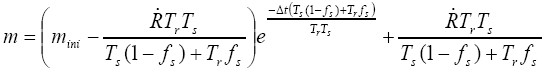 [19]
[19]with mini representing the initial mass in the airway at the start of time increment ∆t. 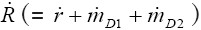 is assumed to be constant during ∆t. The further modelling procedure is described in detail by Asgharian et al. (22) and thus will be, for the sake of brevity, not discussed in this contribution. However, it has to be mentioned that computations according to the equations [16] to [19] have to be performed for all the airways of a specific clearance path until the trachea is reached.
Modelling results
Particle deposition in patients with chronic bronchitis
As can be recognized from the results graphs depicted in Figures 2-4, particle deposition in patients suffering from bronchitis remarkably differs from that of healthy subjects, whereby the degree of this divergence depends upon the applied airway calibration model. Concerning total particle deposition under sitting and light-work breathing conditions (20) (Figure 2), unit-density particulate mass ranging from 0.001 µm to 10 µm is generally subject to a higher deposition in the respiratory tract of bronchitis patients with respect to healthy subjects. Depending upon the used calibration model, differences of total deposition vary between 5% and 10% for particles smaller than 1 µm and reach up to 20% for particles greater than 1 µm. Lowest deposition values are principally obtained for aerosol particles with a diameter of about 0.5 µm, which is due to a minimum effect of deposition forces within this size category. By changing the breathing conditions from sitting to light-work breathing only insignificant modifications of the deposition curves are recognizable, which mainly concern a lower deposition around the curve minimum and higher deposition in the case of large particles.


With regards to the regional deposition, the human respiratory tract was subdivided into three main compartments, i.e., the extrathoracic region (ET), the tubular compartment (TUB), containing the entire bronchial network, and the alveoli (ALV). Particle deposition was again computed based upon the calibration algorithms noted above and two different breathing conditions (sitting and light-work breathing; Figure 3). Regional deposition behaviour was investigated for four size categories: 0.01, 0.10, 1.0, and 10 µm. Under sitting breathing conditions (Figure 2A,B,C,D), 0.01-µm particles preferentially deposit in the tubular region, followed by the alveoli and the extrathoracic compartment, whereby tubular and alveolar deposition are enhanced in bronchitis lungs with respect to healthy lungs. A similar tendency may be observed for the 0.10-µm and 1.0-µm particles, although particulate matter belonging to these size categories is generally accumulated in the respiratory tract to a much lower extent. A completely different picture may be obtained for the 10-µm particles, whose preferable deposition takes place in the extrathoracic region, followed by the tubular compartment. The lung alveoli are only reached by an insignificant particle fraction, underlining the high filter efficiency of the lung airways with regards to this particle class. Any modifications of the lung architecture do not remarkably influence the deposition behaviour of these large particles. A change from sitting to light-work breathing (Figure 3E,F,G,H) only leads to slight modifications of single deposition fractions, which have to be evaluated as most remarkable for the smallest particle category, where alveolar deposition increases at the cost of tubular deposition, and for the largest particle category, where the extrathoracic deposition fraction is enhanced at the cost of the respective tubular fraction.
Airway generation-specific deposition patterns as those illustrated in Figure 4 provide an appropriate information of eventual particle deposition maxima in single bronchial bifurcations. In analogy to regional deposition, local deposition patterns were computed for the four particle classes and the two breathing conditions noted above. Concerning sitting breathing conditions (Figure 4A,B,C,D), deposition patterns of 0.01-µm, 0.10-µm, and 1.0-µm particles are characterized by clear maxima that are positioned in airway generation 17 in the first case and in airway generation 20 in the second and third case. The percentage fraction of deposited particulate mass significantly decreases with increasing particle diameter, and, furthermore, a modified calibration of the airways due to the simulation of bronchitis causes a remarkable enhancement of this maximum deposition fraction. Again, the 10-µm particles fall from the row insofar as maximum deposition takes place in the first two airway generations, whilst in the following bifurcations deposition is subject to a continuous decline. This effect is amplified in bronchitis patients. Under light-work breathing conditions, deposition maxima of all size categories are more or less significantly decreased with respect to slower inhalation (Figure 4E,F,G,H). This effect may be chiefly observed for the 10-µm particles, from which only few percent are able to penetrate into the thoracic part of the respiratory system. In general, differences of local deposition between bronchitis and healthy lungs become smaller under the given breathing conditions.
Tracheobronchial clearance in patients with chronic bronchitis
As depicted in Figures 5,6 tracheobronchial clearance primarily depends upon the size of the aerosol particles deposited in the airway tubes, because (I) particles with different diameters provide different slow clearance fractions according to equation [18], and (II) particle size has an effect on the respective deposition patterns (see Figure 4) being an important basis for the subsequent clearance process. In analogy to the simulation of particle deposition, retention curves were drawn for four particle sizes (0.01, 0.10, 1.00, and 10.0 µm) that had been deposited in the tracheobronchial tree under two different breathing conditions (sitting and light-work breathing). Concerning the 0.01-µm and 0.10-µm particles, very similar retention curves are obtained (Figure 5A,B), whereby in the case of healthy subjects a fast clearance phase including about 20% of the deposited particulate mass is finished after 10 hours, and a slow clearance phase including the remaining particle mass requires about 10 to 15 days. In the case of bronchitis patients fast mucociliary clearance is slightly slowed down, resulting in an overall clearance time, which exceeds that of the healthy controls by one to two days. With regards to the 1.00-µm particles fast clearance comprises about 35% of the particles deposited in the airways (Figure 5C), and discrepancies of the clearance behaviour between healthy subjects and bronchitis patients become nearly negligible for this particle category. For the 10.0-µm particles practically no slow clearance fraction is obtained, resulting in an efficient particle evacuation out of the lungs within 10 to 20 hours (Figure 5D). Again, differences between healthy and bronchitis lungs are insignificant. A switch from sitting to light-work breathing deposition has only very small effects on particle clearance, which become chiefly evident for larger particles (Figure 5E,F,G,H). Whilst for the 1.00-µm particles the fraction cleared by the mucociliary escalator is slightly enhanced (38%), fast clearance of the 10.0-µm particles is subject to a further acceleration that is mainly recognized in the bronchitis patients.

The 24-hour retention value illustrated in Figure 6 indicates the particle fraction that is still retained in the tracheobronchial tree 24 hours after exposure to the respective aerosol. This value is frequently used in pneumology to describe clearance efficiency. Highest estimates for 24-hour retention (>0.65) are obtained for particles sizes smaller than 0.10 µm, covering the size spectrum of the so-called ultrafine particles. For particle sizes greater than 0.10 µm 24-hour retention is generally subject to a rapid decline with increasing particle diameter, whereby 10.0-µm particles are mostly cleared within 24 hours. Due to chronic bronchitis 24-hour retention values are enhanced by a maximum of 10%, indicating only a small impair-ment of tracheobronchial clearance by the disease under the supposed model frame conditions. As already supposed from the retention graphs of Figure 5, differences of particle deposition patterns obtained from the change of breathing conditions are only insignificant (Figure 6A,B). A scenario of continuous mucus velocity reduction due to a progressing exacerbation of bronchitis is illustrated in Figure 7. As can be clearly recognized, within the tracheal mucus velocity range from 5 to 15 mm∙min-1 practically no change of the 24-hour retention is provided (see above). Any further decline of the mucus velocity in the trachea leads to a more or less linear increase of the retention value, whereby most significant enhancement of this key parameter can be observed for large particles. Here, the whole particle fraction is subject to the mucociliary clearance process, so that any delay of remarkable extent becomes more clearly visible than for smaller particles.


Discussion and conclusions
Patients suffering from chronic bronchitis exhibit partly remarkable changes of the tracheobronchial architecture, which have a measurable effect on the deposition of variably sized aerosol particles. As could be demonstrated by a mathematical model, within which bronchitis-induced changes of the airway calibers find their appropriate consideration, total particle deposition in bronchitis patients is subject to a significant increase in bronchitis patients with respect to healthy controls. These results correspond well with [1] respective data provided by earlier mathematical approaches (34-37) and [2] deposition data derived from inhalation experiments with healthy and diseased subjects (21). Model calculations further exhibit that for particles ≤2.0 µm the tracheobronchial airways represent the preferential site of deposition, whilst larger particles are increasingly filtered in the extrathoracic region of the human respiratory tract (25,38,39). Deposition-by-generation graphs clearly show deposition maxima of small particles in the peripheral airways of the lungs, underlining the ability of these specific particles to penetrate deeply into the respiratory system. The increased particle deposition in bronchitis patients has two consequences: first, environmental pollutants are deposited in diseased lungs to a higher extent, whereby smaller particles (<1.0 µm) have higher tendency to reach the alveoli. Second, therapeutic aerosols with optimum size and administered under optimum breathing conditions can be directed to their target sites with high efficiency. Hence, deposition models have to be understood as supporting tools for the development of therapeutic aerosols as well as the optimization of inhalation procedures.
Tracheobronchial clearance in chronic bronchitis patients is chiefly affected by the hypersecretion of mucus and, at later stages of the disease, by a continuous disintegration of epithelial cilia being responsible for the movement of the mucociliary escalator (33). Patients with mild to intermediate symptoms of bronchitis only show a slightly reduced clearance with respect to healthy controls, and in some cases clearance of such patients is also accelerated. However, the effect of tracheobronchial clearance acceleration becomes most evident during work requiring an intermediate to advanced grade of physical mobility (20). Additionally, this phenomenon may be observed in smokers suffering from light bronchitis, where nicotine and other tobacco ingredients may enhance the activity of ciliated cells. With further progress of the disease, structural changes in the tracheobronchial tree are responsible for successive slowing down of the clearance process, resulting in a significantly prolonged retention of particulate mass in the lung airways, which may have further hygienic consequences (1-4). Contrary to the deposition scenarios discussed above, experimental evidence underlining the validity of the computed clearance data are only available in scarce amounts (20). Also in this case good agreement between theory and experiment may be attested, whereby main limitations of the clearance model are given regarding a close-to-realistic definition of bronchitis-induced airway obstructions and emphysematic changes of lung architecture (40). Further, considerations of advanced particle properties essential for the understanding of therapeutic aerosol transport behaviour have to be continuously refined, starting with regularly shaped particles (spheres, fibers, oblate disks) and finishing with irregularly shaped particle aggregates (41). Solution of such highly important questions will be the main task of theoretical studies being carried out in the following years.
Acknowledgements
Disclosure: The author declares no conflict of interest.
References
- Barnes PJ. Chronic obstructive pulmonary disease. N Engl J Med 2000;343:269-80.
- Standards for the diagnosis and care of patients with chronic obstructive pulmonary disease. American Thoracic Society. Am J Respir Crit Care Med 1995;152:S77-121.
- Madison JM, Irwin RS. Chronic obstructive pulmonary disease. Lancet 1998;352:467-73.
- Barnes PJ. Mechanisms in COPD: differences from asthma. Chest 2000;117:10S-4S.
- Vestbo J, Prescott E, Lange P. Association of chronic mucus hypersecretion with FEV1 decline and chronic obstructive pulmonary disease morbidity. Copenhagen City Heart Study Group. Am J Respir Crit Care Med 1996;153:1530-5.
- Saetta M. Airway pathology of COPD compared with astma. Eur Resp Rev 1997;6:270-5.
- Culpitt SV, Maziak W, Loukidis S, et al. Effect of high dose inhaled steroid on cells, cytokines, and proteases in induced sputum in chronic obstructive pulmonary disease. Am J Respir Crit Care Med 1999;160:1635-9.
- Keatings VM, Jatakanon A, Worsdell YM, et al. Effects of inhaled and oral glucocorticoids on inflammatory indices in asthma and COPD. Am J Respir Crit Care Med 1997;155:542-8.
- Barnes PJ. New therapies for chronic obstructive pulmonary disease. Thorax 1998;53:137-47.
- Barnes PJ. Novel approaches and targets for treatment of chronic obstructive pulmonary disease. Am J Respir Crit Care Med 1999;160:S72-9.
- Torphy TJ. Phosphodiesterase isozymes: molecular targets for novel antiasthma agents. Am J Respir Crit Care Med 1998;157:351-70.
- Silagy C, Mant D, Fowler G, et al. Meta-analysis on efficacy of nicotine replacement therapies in smoking cessation. Lancet 1994;343:139-42.
- Boyd G, Morice AH, Pounsford JC, et al. An evaluation of salmeterol in the treatment of chronic obstructive pulmonary disease (COPD). Eur Respir J 1997;10:815-21.
- Vestbo J, Sørensen T, Lange P, et al. Long-term effect of inhaled budesonide in mild and moderate chronic obstructive pulmonary disease: a randomised controlled trial. Lancet 1999;353:1819-23.
- Burge PS, Calverley PM, Jones PW, et al. Randomised, double blind, placebo controlled study of fluticasone propionate in patients with moderate to severe chronic obstructive pulmonary disease: the ISOLDE trial. BMJ 2000;320:1297-303.
- Niewoehner DE, Erbland ML, Deupree RH, et al. Effect of systemic glucocorticoids on exacerbations of chronic obstructive pulmonary disease. Department of Veterans Affairs Cooperative Study Group. N Engl J Med 1999;340:1941-7.
- Davies L, Angus RM, Calverley PM. Oral corticosteroids in patients admitted to hospital with exacerbations of chronic obstructive pulmonary disease: a prospective randomised controlled trial. Lancet 1999;354:456-60.
- Hughes JM, Hoppin FG Jr, Mead J. Effect of lung inflation on bronchial length and diameter in excised lungs. J Appl Physiol 1972;32:25-35.
- Phalen RF, Oldham MJ, Beaucage CB, et al. Postnatal enlargement of human tracheobronchial airways and implications for particle deposition. Anat Rec 1985;212:368-80.
- International Commission on Radiological Protection (ICRP). Human Respiratory Tract Model for Radiological Protection. ICRP Publication 66. Oxford, UK: Pergamon Press, 1994.
- Kim CS, Kang TC. Comparative measurement of lung deposition of inhaled fine particles in normal subjects and patients with obstructive airway disease. Am J Respir Crit Care Med 1997;155:899-905.
- Pedley TJ, Schroter RC, Sudlow MF. The prediction of pressure drop and variation of resistance within the human bronchial airways. Respir Physiol 1970;9:387-405.
- Koblinger L, Hofmann W. Analysis of human lung morphometric data for stochastic aerosol deposition calculations. Phys Med Biol 1985;30:541-56.
- Kim CS, Brown LK, Lewars GG, et al. Deposition of aerosol particles and flow resistance in mathematical and experimental airway models. J Appl Physiol 1983;55:154-63.
- Koblinger L, Hofmann W. Monte Carlo modeling of aerosol deposition in human lungs. Part I: Simulation of particle transport in a stochastic lung structure. J Aerosol Sci 1990;21:661-74.
- Hinds WC. eds. Aerosol technology: properties, behaviour, and measurement of airborne particles (2nd ed.). New York, US: Wiley, 1999.
- Colbeck I. eds. Physical and chemical properties of aerosols. London, UK: Blackie Acad & Professional, 1998.
- Finlay WH. eds. The mechanics of inhaled pharmaceutical aerosols: an introduction. San Diego, US: Academic Press, 2001.
- Yeh HC, Schum GM. Models of human lung airways and their application to inhaled particle deposition. Bull Math Biol 1980;42:461-80.
- Sturm R, Hofmann W, Scheuch G, et al. Particle Clearance in Human Bronchial Airways: Comparison of Stochastic Model Predictions with Experimental Data. Ann Occup Hyg 2002;46:329-33.
- Hofmann W, Sturm R. Stochastic model of particle clearance in human bronchial airways. J Aerosol Med 2004 Spring;17:73-89.
- Asgharian B, Hofmann W, Bergmann R. Particle deposition in a multiple-path model of the human lung. Aerosol Sci Technol 2001;34:332-9.
- Rogers DF. Mucociliary dysfunction in COPD: effect of current pharmacotherapeutic options. Pulm Pharmacol Ther 2005;18:1-8.
- Martonen T, Katz I, Cress W. Aerosol deposition as a function of airway disease: cystic fibrosis. Pharm Res 1995;12:96-102.
- Martonen TB, Hwang D, Katz I, et al. Cystic fibrosis: Treatment with a supercomputer drug delivery model. Adv Engin Software 1997;28:359-64.
- Segal RA, Martonen TB, Kim CS, et al. Computer simulations of particle deposition in the lungs of chronic obstructive pulmonary disease patients. Inhal Toxicol 2002;14:705-20.
- Brown JS, Bennett WD. Deposition of coarse particles in cystic fibrosis: model predictions versus experimental results. J Aerosol Med 2004 Fall;17:239-48.
- Hofmann W, Daschil F. Biological variability influencing lung dosimetry for inhaled 222Rn and 220Rn decay products. Health Phys 1986;50:345-67.
- Hofmann W, Koblinger L. Monte Carlo modeling of aerosol deposition in human lungs. Part III: Comparison with experimental data. J Aerosol Sci 1992;23:51-63.
- Sturm R, Hofmann W. Stochastic simulation of alveolar particle deposition in lungs affected by different types of emphysema. J Aerosol Med 2004 Winter;17:357-72.
- Sturm R, Hofmann W. A theoretical approach to the deposition and clearance of fibers with variable size in the human respiratory tract. J Hazard Mater 2009;170:210-8.

