
Spatial visualization of theoretical nanoparticle deposition in the human respiratory tract
Introduction
By definition, nanoparticles represent particulate substances with equivalent or aerodynamic diameters adopting values of less than 100 nm (1,2). In extreme cases their size measures only several nanometers and therefore becomes comparable with the size of molecules. From a medical point of view, nanoparticles are of enhanced interest because of their ability to enter the human body via the gastrointestinal, dermal or inhalative path (3). In the respiratory tract particles of the nanometer scale, which are deposited on the bronchial or alveolar walls, have the ability to enter the cardiovascular system within several minutes (4), as far as they are not seized by mucociliary clearance or, after their agglomeration, by macrophage-mediated removal (5,6). Once the nanomaterials have attained the blood capillaries, they may unfold their unwholesome impact, ranging from an increase of plasma viscosity due to enhanced sulfur dioxide and particulate levels (7) to a dramatic rise of the blood coagulability and subsequent stenosis of the coronary vessels (8). In addition to these intravascular effects, nanoparticles may also induce marked cell damage, extensive fibrosis, and malignant transformations resulting in the development of lung carcinoma (9).
As soon as nanoparticles are taken up into the respiratory system, they are seized by a number of forces and, in the case of nonsphericity, also torques, which determine their transport within the bronchial and alveolar structures. As found by several experimental studies (10-13), nanoparticle transport through the lung compartments represents a process mainly controlled by Brownian motion, whereas particle inertia and gravity execute only minor influences on the intrapulmonary trajectories of the inspired substances. Nanoparticles characterized by extremely anisometric geometries (e.g., carbon nanotubes) are additionally grasped by interception, where complex torques result in a contact of the particle with the airway wall, although the center of particle mass follows the stream lines of the inhaled air (14,15). Predominance of Brownian motion leads to an effect, which is commonly known as extrathoracic and upper-bronchial particle filtering and significantly reduces the ability of nanoparticles to penetrate into the deep lung. This phenomenon, however, continuously declines with increasing particle size (16).
Data on the precise distribution of nanoparticles in different structures of the human lung are only available in low amounts hitherto, but could help to increase our knowledge concerning the exact behavior of this particulate substance in the inspired air stream. Meanwhile, deposition models have reached a high level of predictive accuracy, enabling the simulation of a great variety of particle deposition scenarios (17-19). Since modeling results are increasingly confirmed by respective experiments or, with other words, model validation continuously accompanies the development of the theoretical approaches, computer simulations dealing with particle deposition in the lung find an increasing acceptance in respiratory medicine (20).
As most particle deposition models only provide numerical data, which may be submitted to a statistic or graphical analysis, information on the real distribution of particles deposited in the airways and alveoli largely remains hidden in obscurity. In the study presented here, deposition patterns of various nanoparticles (1, 10, 100 nm) were visualized with the help of a computer model allowing the attribution of three-dimensional coordinates to each particle deposited in the tracheobronchial tree and the processing of huge amounts of three-dimensional data. Intrapulmonary particle distributions visualized by this means are compared with ‘conventional’ deposition data generated with a well validated stochastic model (21).
Methods
Generation of spatial particle deposition patterns
The production of spatial deposition data of various nanoparticles was conducted by using the stochastic particle transport and deposition model (IDEAL 6.0) formerly developed by Koblinger and Hofmann (21). This approach, which was subjected to further improvements in the past two decades (17-19), is founded on a probabilistic lung architecture that was generated by the detailed statistical evaluation of lung-morphometric data (22) and the definition of related lung generation-specific probability density functions. For the construction of individual bronchial airways and, consequently, the achievement of intrasubject variability selection of morphometric data out of these functions was carried out with the help of the random number concept (Figure 1A). Particle transport within the probabilistic structure of the tracheobronchial tree was realized by the random walk method, according to which particle trajectories follow a randomly selected path through the network of bronchial airways and acinar ducts. During their transport through the air-conducting structures of the respiratory tract inhaled particles are subject to various forces and, in the case of extremely anisometric particle geometries, also torques, which influence their aerodynamic behavior and their probability of being deposited on the airway walls. In general, Brownian motion, sedimentation, inertial impaction, and interception may be identified as main mechanisms in association with intrapulmonary particle deposition. Concerning particles of the nanometer scale, these mechanisms are chiefly reduced to Brownian motion and interception, whereas sedimentation and inertial impaction play a very subordinate role. Particle deposition was computed by using empirical and analytical formulae, which were formerly defined for bent cylindrical tubes (21,23). Respective deposition data were commonly expressed as deposition probabilities or deposition efficiencies, whereby summative deposition probability of an inspired particle was obtained by simply multiplying the respective deposition probabilities computed for each airway generation (Table 1). Statistical evaluation of particle deposition was conducted by application of the Monte Carlo concept as well as the method of statistical weights (21,24,25).


Full table
For the production of spatial deposition data three-dimensional coordinates of a particle deposited in a randomly oriented airway tube had to be determined. For fulfilling this processing step in an appropriate way, the central axis of that airway tube, in which particle deposition had taken place, was defined as the x-axis of a preliminary coordinate system with its origin at the starting point of the respective airway. Within the cylindrical structure, the exact position of the deposited particle was expressed by a point vector, p, which is defined by the mathematical formula
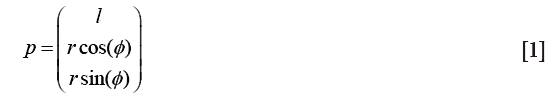
In the equation noted above, r represents the radius of the airway tube, whilst ϕ describes the angle between a line oriented parallel to the y-axis of a Cartesian coordinate system and the supporting vector p1. The factor l denotes the distance between origin of the airway and particle (Figure 1B).
In order to describe the spatial orientation of all airways belonging to a bronchial sequence, within which particle transport and deposition had taken place, the provisionally generated point vectors of Eq. [1] had to be converted to a Cartesian coordinate system with the trachea (airway generation 0) defining the z-direction. By definition, the x-axis of this coordinate system corresponds with the x-direction of the preliminary coordinate system used for Eq. [1]. Conversion of the coordinates was conducted by application of two rotation angles, α and γ, which describe the rotation of a given airway tube relative to the z-axis and relative to the x-y-plane (Figure 1C). Mathematically, rotation of each airway tube was realized by using the two rotation matrices A and Γ:
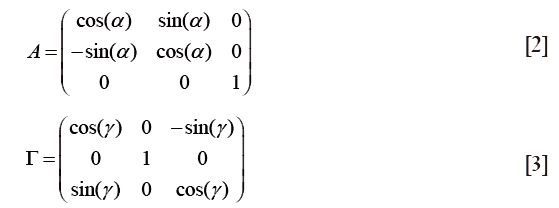
The transformed vector, pT, was obtained by multiplying the vector p with the two rotation matrices A and Γ in the following way:

For randomly generated paths consisting of more than one bronchial airway each tube had to be transformed according to the above-described procedure, finally resulting in a sequence of vectors. Spatial information produced in this way was stored in a specific array containing respective three-dimensional coordinates of all particles (e.g., 10,000) that had undergone a deposition event (24-26).
For the statistical evaluation of spatial particle deposition and quantification of three-dimensional particle distribution in the tracheobronchial tree, a specific voxel grid was used (Figure 1C). In correspondence with the current resolution of medical imaging techniques (e.g., SPECT), one cubic volumetric unit (voxel) was selected to adopt a volume of 0.102 cm3. In general, voxel size is used as a main criterion for determining the resolving power of a visualization method (24).
Computer-aided visualization of spatial deposition data
Visualization of spatial particle distribution within the tracheobronchial tree took place by using a specific software, which is able to plot huge data sets containing thousands of coordinates and to render generated surfaces in an appropriate way. One possibility of fulfilling these demands is given by the Open Visualization Data Explorer that was formerly developed by IBMTM. Originally conceived for UNIX work stations this software also runs on modern personal computers in the meantime. All graphical output produced by the Open Visualization Data Explorer can be manipulated in multiple ways, for instance by changing colors, views and sizes (Figure 2A-C). One of the most important functions of this software is the ability to generate oriented sections through the three-dimensional particle distribution plots. Also the surface of the lung may be visualized and represented by respective sections (Figures 2D,3,4).


Model parameters
Spatial deposition modeling was conducted by assuming spherical unit-density nanoparticles with a size of 1, 10, and 100 nm, respectively. Inhalation of the particulate matter was supposed to take place under light-activity breathing conditions. According to the recommendations of the ICRP (20), this breathing mode is characterized by a tidal volume of 1,250 mL, a breath-cycle time of 3 s (breath-hold: 0 s), and inspiration through the mouth. Computations were carried out for an average lung of a Caucasian male with a functional residual capacity (FRC) of 3,300 mL and a total lung capacity (TLC) of 5,500 mL. Nanoparticle deposition in the extrathoracic and acinar region predicted by the stochastic model were computed by application of empirical and analytical formulae resulting from regression analyses and theoretical considerations (20,21).
Results
Visualization of nanoparticle distribution in the tracheobronchial tree
As clearly demonstrated in Figure 3, spatial deposition patterns resulting from the inhalation of 1-nm particles remarkably differ from respective deposition patterns generated for larger nanoparticles (10 and 100 nm in size). Within the tracheobronchial tree, deposition of particles adopting a size of 1 nm is concentrated in the uppermost airways (trachea, main bronchi, and lobar bronchi) and continuously decreases towards the central and distal airways. As a consequence of this deposition behavior, alveolated airways are occupied by these nanoparticles only in negligible number. A contrary picture is given for 10-nm particles, which are distributed over the whole tracheobronchial tree and provide some deposition maxima in the deeper lungs. Here, enhanced deposition starts in the main bronchi and is continued towards the alveolated structures. Comparison of deposition patterns generated by 10-nm particles with those generated by 100-nm particles shows that larger nanoparticles are accumulated in the tracheobronchial structures with lower quantities. This circumstance is among other expressed by the lack of discrete deposition maxima in the case of 100-nm particles. Another essential feature of the 100-nm particle deposition pattern is a further translocation of deposition sites towards more peripheral lung regions.
For a more detailed insight into the deposition behavior of 10-nm particles, three vertical and horizontal sections through the spatial particle distribution pattern were generated, respectively (Figure 4). Thereby, the vertical images include a median section as that already provided in Figure 3 and two sections shifted in ventral direction (10 voxels and 20 voxels). Horizontal images contain an apical section (height measured from the lung base: 45 voxels), an intermediate section (height: 35 voxels) as well as a basal section (height: 25 voxels). The sections markedly exhibit higher nanoparticle concentrations in the central and lower lung and thus underline the high penetration depth known for this particle category.
Particle deposition patterns predicted by the stochastic model
Regional deposition data depicted in Figure 5A already correspond very well with the results obtained from the spatial visualization procedure. As exhibited by the quantitative predictions of the stochastic model, 1-nm particles preferably deposit in the extrathoracic region (33.6%), followed by the bronchial region (59.2%) and the acinar compartment (0.98%). Hence, total deposition of this nanoparticle amounts to 93.7%. A significantly different picture is given for the 10-nm particles, which are deposited in the extrathoracic region by 7.64%, in the bronchial region by 29.2% and in the acinar region by 36.3% (total deposition: 73.1%). The 100-nm particles show an extrathoracic deposition of 1.94%, a bronchial deposition of 4.74%, and an acinar deposition of 17.2%, resulting in a total deposition of 23.9%.

As another possibility of the quantitative representation of intrapulmonary particle deposition, airway generation-specific deposition graphs were generated (Figure 5B). Concerning the local deposition of 1-nm particles, maximum particle concentration may be attested for the upper airway generations 6 to 10. Respective deposition efficiencies range from 4.7% to 5.7%. Whilst in airway generations 0 to 5 deposition efficiency uniformly adopts values >3.7%, in central and peripheral airways it is subject to a rapid decline. With regard to 10-nm particles, deposition efficiency performs a permanent increase from airway generation 0 (trachea) to airway generation 17, thereby adopting a maximum value of 6.82%. In more distal airway generations (>18), deposition efficiency rapidly decreases, with respective values <0.1% being recognized for airway generation numbers ≥24. Deposition efficiency of 100-nm particles is also continuously enhanced from the trachea to the peripheral lung, but, compared to the 10-nm particles, this increase takes place in a significantly diminished fashion. Maximum deposition efficiency is attained in airway generation 19 and adopts a value of 2.42%. Valuable deposition continues to airway generation 25.
Discussion
Mathematical models describing the deposition of particles in the human respiratory tract are subject to a long tradition. Early approaches of the 1970s intended the prediction of particle deposition within a symmetric (deterministic) lung structure or, alternatively, within a so-called ‘trumpet model’ of the tracheobronchial tree, where cross sections of all airways belonging to a specific airway generation are summarized and particle deposition is described as function of these summative cross sections (27,28). Since the 1980s particle deposition models have continued their evolution insofar as deterministic lung architecture has been successively replaced by a more realistic stochastic structure (21,22,29). This morphology, which has been applied either to the lobar lung regions (23) or to the whole tracheobronchial section (21,22), produces a morphometric variability of the bronchial tubes within a given airway generation. As a main result of this phenomenon commonly known as ‘intrasubject variability’, distances from the trachea to the closing sacs are not constant anymore, but are subject to a partly remarkable variation. Most current particle deposition models follow two primary goals: firstly, they want to present particle aerodynamics in the different lung structures in a highly realistic manner, thereby using the Navier-Stokes equation as mathematical basis; secondly, they want to increase the quality of visualization of particle deposition in single airway bifurcations or in the entire tracheobronchial tree (14,24-26).
As already demonstrated in earlier contributions (24-26), generation of a three-dimensional lung structure and single particle trajectories running through the stochastically constructed sequences of airway tubes enables the computation of spatial deposition data. These results may be visualized as three-dimensional distribution plots or, in order to increase the compatibility with other visualization techniques (e.g., CT or MRT), as sectional distribution plots. Reliability of the spatial deposition models has been already proofed for particles of the micrometer scale, where partly excellent correspondence between theoretical predictions and related data obtained from single photon emission computer tomography (SPECT) measurements was attained (30). In the meantime, also changes of spatial particle distribution due to the mucociliary clearance process were simulated and visualized. Here future efforts primarily include the consideration of slow clearance mechanisms, which are mainly located in the small ciliated airways and in the alveolar structures (31-34).
According to the spatial deposition model, transport and deposition behavior of nanoparticles entering the respiratory tract may be interpreted as a phenomenon, which is chiefly controlled by particle size. Whilst 1-nm particles mostly deposit in the upper regions of the respiratory tract, 100-nm particles exhibit a completely contrary tendency regarding their deposition. Highest fractions of these ‘large’ nanoparticles are accumulated in the acinar compartment, whereas the extrathoracic and bronchial regions are only occupied by low fractions. From a physical point of view, deposition of nanoparticles is mainly driven by Brownian motion, whose efficiency is subject to an exponential decline with growing equivalent or aerodynamic diameter of a given particle. Numerous experimental studies could demonstrate that in the case of spherical nanoparticles plotting within a size range of 1 to 100 nm particle depositions on the bronchial and alveolar walls are instead of is almost solely controlled by diffusive processes except for the circumstance that the particle has an extremely anisometric shape. Nanoparticles with extraordinarily high aspect ratios (carbon nanotubes) additionally undergo a deposition by interception (14,35). For particles with sizes greater than 0.5 µm mass becomes a physical determinant with increasing importance insofar as deposition mechanisms founded on inertia and gravity start to receive a certain predominance (19-21). With regard to ‘large’ particles exceeding a size of 3 µm Brownian motion only plays a negligible role and is clearly surpassed in efficiency by inertial impaction, interception, and gravitational settling (21,36).
As already outlined in the introduction, inhalation of nanomaterials in high doses may result in a significant impairment of health. Fortunately most nanoparticles are of artificial origin and thus do not occur in aerosolized form in the ambient air. Measurable exposure to primary or agglomerated nanoparticles is documented for specific industrial workers, whereby uptake of the nanomaterials may take place via inhalation, ingestion or the dermal path (3). The hazardous effect of nanoparticles depends on several factors, among which biosolubility, particle geometry, and the ability of binding foreign elements on the particle surface are of enhanced relevance (37). Epidemiological as well as experimental and theoretical investigations could demonstrate that nanoparticles may bear the potential to induce inflammatory processes or, in the worst case, also malignant transformations (37). Although numerous health hazards originating from the uptake of nanoparticles have been documented hitherto, respective risk assessments concerning this specific particle category are still rather dissatisfactory. Here, theoretical models describing the spatial distribution of nanoparticles in the respiratory tract might provide a valuable support. Besides their possible contributions to future risk assessments theoretical approaches like that introduced in this paper may find two further applications in the following years: firstly, they might provide significant support with regard to the optimization of inhalative therapies and, secondly, they might contribute to the design of inhalation experiments, which help to better understand the aerodynamic specificities of diverse nanomaterials.
Acknowledgements
None.
Footnote
Conflicts of Interest: The author has no conflicts of interest to declare.
References
- Aitken RJ, Creely KS, Tran CL. Nanoparticles: An occupational hygiene review. Research Report 274. Norwich: HSE-Books, 2004.
- Maynard AD. Nanotechnology: the next big thing, or much ado about nothing? Ann Occup Hyg 2007;51:1-12. [PubMed]
- Donaldson K, Aitken R, Tran L, et al. Carbon nanotubes: a review of their properties in relation to pulmonary toxicology and workplace safety. Toxicol Sci 2006;92:5-22. [PubMed]
- Geiser M, Rothen-Rutishauser B, Kapp N, et al. Ultrafine particles cross cellular membranes by nonphagocytic mechanisms in lungs and in cultured cells. Environ Health Perspect 2005;113:1555-60. [PubMed]
- Sturm R. Theoretical and experimental approaches to the deposition and clearance of ultrafine carcinogens in the human respiratory tract. Thoracic Cancer 2011;2:61-8.
- Sturm R. Theoretical models of carcinogenic particle deposition and clearance in children's lungs. J Thorac Dis 2012;4:368-76. [PubMed]
- Peters A, Döring A, Wichmann HE, et al. Increased plasma viscosity during an air pollution episode: a link to mortality? Lancet 1997;349:1582-7. [PubMed]
- Peters A, Wichmann HE, Tuch T, et al. Respiratory effects are associated with the number of ultrafine particles. Am J Respir Crit Care Med 1997;155:1376-83. [PubMed]
- Rojas M, Marie B, Vignaud JM, et al. High DNA damage by benzo[a]pyrene 7,8-diol-9,10-epoxide in bronchial epithelial cells from patients with lung cancer: comparison with lung parenchyma. Cancer Lett 2004;207:157-63. [PubMed]
- Schiller CF, Gebhart J, Heyder J, et al. Deposition of monodisperse insoluble aerosol particles in the 0.005 to 0.2 µm size range within the human respiratory tract. Ann Occup Hyg 1988;32:41-9.
- Jaques PA, Kim CS. Measurement of total lung deposition of inhaled ultrafine particles in healthy men and women. Inhal Toxicol 2000;12:715-31. [PubMed]
- Kim CS, Jaques PA. Respiratory dose of inhaled ultrafine particles in healthy adults. Phil Trans Royal Soc Lond A 2000;358:2693-705.
- Oberdörster G. Pulmonary effects of inhaled ultrafine particles. Int Arch Occup Environ Health 2001;74:1-8. [PubMed]
- Högberg SM. Modeling nanofiber transport and deposition in human airways. Luleå: Luleå tekniska universitet, 2010.
- Hinds WC. Aerosol Technology: Properties, Behavior, and Measurement of Airborne Particles. New York: John Wiley, 1999.
- Willeke K, Baron PA. Aerosol measurement. New York: John Wiley, 1993.
- Sturm R, Hofmann W. A computer program for the simulation of fiber deposition in the human respiratory tract. Comput Biol Med 2006;36:1252-67. [PubMed]
- Sturm R. Deposition and cellular interaction of cancer-inducing particles in the human respiratory tract: Theoretical approaches and experimental data. Thoracic Cancer 2010;4:141-52.
- Sturm R, Hofmann W. A theoretical approach to the deposition and clearance of fibers with variable size in the human respiratory tract. J Hazard Mater 2009;170:210-8. [PubMed]
- International Commission on Radiological Protection (ICRP). Human respiratory tract model for radiological protection, Publication 66. Oxford: Pergamon Press, 1994.
- Koblinger L, Hofmann W. Monte Carlo modeling of aerosol deposition in human lungs. Part I: Simulation of particle transport in a stochastic lung structure. J Aerosol Sci 1990;21:661-74.
- Koblinger L, Hofmann W. Analysis of human lung morphometric data for stochastic aerosol deposition calculations. Phys Med Biol 1985;30:541-56. [PubMed]
- Yeh HC, Schum GM. Models of human lung airways and their application to inhaled particle deposition. Bull Math Biol 1980;42:461-80. [PubMed]
- Bergmann R, Hofmann W. Monte Carlo simulation of two-dimensional SPECT images. J Aerosol Med 1999;12:126.
- Sturm R, Hofmann W. 3D-Visualization of particle deposition patterns in the human lung generated by Monte Carlo modeling: methodology and applications. Comput Biol Med 2005;35:41-56. [PubMed]
- Sturm R, Hofmann W. Stochastic model for the spatial visualization of particle-deposition patterns in the lung and their significance in lung medicine. Z Med Phys 2006;16:140-7. [PubMed]
- Horsfield K, Dart G, Olson DE, et al. Models of the human bronchial tree. J Appl Physiol 1971;31:207-17. [PubMed]
- Taulbee DB, Yu CP. A theory of aerosol deposition in the human respiratory tract. J Appl Physiol 1975;38:77-85. [PubMed]
- Hofmann W, Daschil F. Biological variability influencing lung dosimetry for inhaled 222Rn and 220Rn decay products. Health Phys 1986;50:345-67. [PubMed]
- Hofmann W, Bolt L, Sturm R, et al. Simulation of three-dimensional particle deposition patterns in human lungs and comparison with experimental SPECT data. Aerosol Sci Technol 2005;39:771-81.
- Sturm R, Hofmann W. Mechanistic interpretation of the slow bronchial clearance phase. Radiat Prot Dosimetry 2003;105:101-4. [PubMed]
- Hofmann W, Sturm R. Stochastic model of particle clearance in human bronchial airways. J Aerosol Med 2004;17:73-89. [PubMed]
- Sturm R. A computer model for the clearance of insoluble particles from the tracheobronchial tree of the human lung. Comput Biol Med 2007;37:680-90. [PubMed]
- Sturm R. A three-dimensional model of tracheobronchial particle distribution during mucociliary clearance in the human respiratory tract. Z Med Phys 2013;23:111-9. [PubMed]
- Sturm R. Nanotubes in the human respiratory tract - Deposition modeling. Z Med Phys 2015;25:135-45. [PubMed]
- Hofmann W, Sturm R, Winkler-Heil R, et al. Stochastic model of ultrafine particle deposition and clearance in the human respiratory tract. Radiat Prot Dosimetry 2003;105:77-80. [PubMed]
- Sturm R. Theoretical and experimental approaches to the deposition and clearance of ultrafine carcinogens in the human respiratory tract. Thoracic Cancer 2011;2:61-8.

