
The genetic epidemiology of the form of microcephaly ascribed to mutation at the WDR62 locus
Introduction
Penrose has a section entitled “Microcephaly” in which he uses shape of head to differentiate categories of microcephaly (1). He includes a diagram, specific to adult males, for illustrative purposes, which places an individual’s measurements of length and breadth of head as coordinates on a plane. “Microcephaly”, as a diagnostic category, is located as a point, low in both length and breadth, but also with relatively low cephalic index (breadth/length). He further refines the classification as follows: “The group of relatively long-headed microcephalics includes a type which is caused by a single recessive gene and which has been termed ‘true microcephaly’”. Later research has dissected this category into further sub-categories with a recessive mode of inheritance. It appears that current practice is to use head circumference and to diagnose microcephaly when circumference is more than three standard deviations below the age and sex standardized mean.
Penrose gives a pedigree, taken from his Colchester Survey, which shows two affected offspring of an uncle-niece union (2). The caption to the pedigree notes that the mother and aunt of the microcephalics suffered from manic depressive psychosis.
Penrose states that the gene frequency of recessive true microcephaly in the Swedish population has been estimated as between 1/162 and 1/230. Obviously the corresponding values applying to sub-categories would be much lower than these.
Thornton and Woods point out that findings from research on autosomal recessive primary microcephaly (MCPH, or microcephaly primary hereditary) offer insights into neurogenesis—“the process by which neurons are generated during embryonic development” (3). MCPH2 (chromosome location 19q13.12-q13.2) is one of seven loci listed. In this paper (Thornton & Woods), the gene is not identified, the protein unknown, the cellular localisation unknown and the function unknown. They state that the incidence of MCPH is ~1 in 10,000 in consanguineous populations and less in non-consanguineous populations. They claim that MCPH2 accounts for 10% of MCPH cases, an estimate which is relevant to estimation of mutation rate and frequency of the specific mutant allele, which is our principal aim.
The objects of this paper are to give formulae which relate the incidence of the disorder to the mutation rate and the fitness of those affected and to show how the frequency of the mutant allele depends on the average level of inbreeding in the population.
The latter object requires a system of mating which sustains the chosen level of inbreeding. The next section specifies the mating system in the form of a parental matrix. This is used in the subsequent section to generate the properties of the population in equilibrium. The incidence of the disorder is derived. Then follows a section on the evolution of dominance. The paper concludes with some general comments.
The general mating equilibrium model
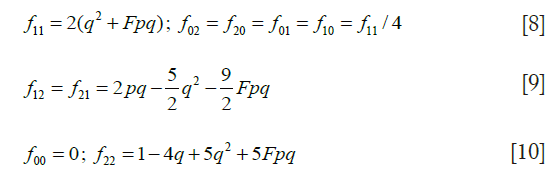
We deal only with a single autosomal locus with two alleles U and T with frequencies in the population q and p(q+p=1). Throughout q remains constant because this is guaranteed by the nature of the selected mating system. A set of frequencies of genotypes {UU,UT,TT} can be represented in terms of q and a measure of departure from Hardy-Weinberg (HW) form F as, say, a'={q2+Fpq,2pq−2Fpq,p2+Fpq}. These will vary according to F and will be denoted generally by {f0,f1,f2}, (f0+f1+f2=1) that is f0=q2+Fpq, etc.
The population is maintained in discrete generations according to the mating scheme
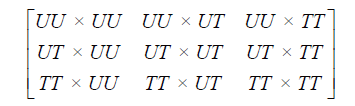
with commensurate pairing frequencies given by the matrix
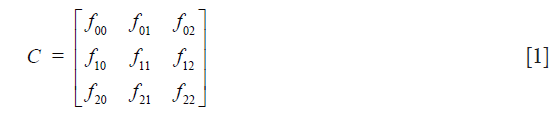
C is symmetric, that is fij=fji, with row and column sums {f0,f1,f2}. This triple of sums is the parental frequency distribution.
Below we use C in the extended (row vector) form

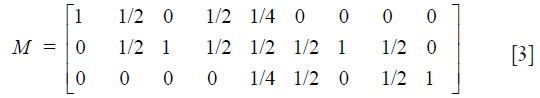
To follow the progression of generations we need Mendel’s coefficients of heredity given in matrix form by
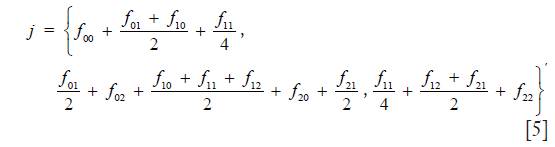
Then the frequency distribution of juveniles is calculated from

which in detail is
The population is in equilibrium, that is: the distribution of juveniles is the same as that of adults, if and only if matrix C has, in addition to the properties given above, the special property

This identity allows for non-random mating (NRM) as well as random mating (RM).
A schematic illustration of the admissible region is given in Figure 1. The details are explained fully in Stark (4). For a fixed value of q, points within the region are given by the set of coordinates {F,f11,f01}. Table 1 gives the coordinates of points in Figure 1. The admissible set of points are within the region defined by vertices O V Z D.

Full table

Use of the parental matrix to find the state of equilibrium
A principal object of the paper is to explore the effect of inbreeding (F >0). This requires the choice of mating system consistent with equilibrium. This is illustrated by Figure 1. The choice of parental matrix is arbitrary, identified by the star within the section defined by the inbreeding coefficient F. The details of the coordinates are given below.
Starting from frequency q0 of the mutant allele, introduce mutation by the substitution

where μ is half the sum of the mutation rates in eggs and sperm. Using q, form a parental matrix C for a population with mean coefficient of inbreeding F, with the following elements:
Calculate an updated trio of offspring genotypic frequencies {f0,f1,f2} from j defined by Eq. [5] in the previous section.
Next, calculate post-selection frequencies

where 1-s is the proportion of mutant homozygotes contributing offspring to the next generation.
Finally, calculate an updated value of q from

Repeat this process for a number of generations until a sufficiently accurate estimate of equilibrium  is achieved. The incidence of microcephaly is

Eq. [13] is apparently anomalous in that the incidence of the disorder does not appear to depend on the frequency of the mutant allele, but it is approximately equal to the equilibrium value of f0=q2+Fq(1−q) replacing by q. The next paragraph gives a heuristic explanation.
Carter gives the traditional account of the relevant genetic epidemiology in a section entitled “Frequency and dangers of recessive mutant genes” (5). In Carter’s notation, the “proportion of individuals born genetically pre-disposed to develop the disorder” is
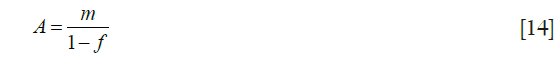
where m is the mutation rate and f is the fitness of homozygotes of the mutant allele. Note the apparent independence of incidence on the frequency of the mutant allele.
Carter’s formula can be explained through the recurrence relation connecting the mutant genes exposed to ‘culling’ (selection) in successive generations:

Because the trait is recessive, two copies of the mutant are removed when an affected individual does not reproduce, but a proportion 1−s does; members of the following generation are subject to mutation at rate μ for each chromosome. At equilibrium, subscripts can be omitted, leading to the identity

the solution of which is

Similar reasoning leads to an approximate value for the gene frequency at equilibrium. Taking Q as the gene frequency at generation t +1 and q at generation t and exploiting the fact that the frequency of the wild-type gene is close to unity, form the recurrence relation

At equilibrium, Q = q, leading to a solution for q:
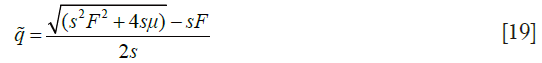
Eq. [19] is illustrated by Figure 2 in which μ=5×10⁻⁶ for two values of F, and s in the interval 0.8 to 1. The circles show the values at equilibrium reached from the recurrence relations and the unbroken lines are calculated using Eq. [19]. Figure 2 shows how gene frequency depends on μ, s, and F.

The incidence of the disorder and the average inbreeding coefficient
The coefficient of common identity between two individuals A and B, denoted by CAB is defined as the probability that a gene drawn at random from A is identical by descent to either one or both homologous genes of B (6). The order of A and B must be observed strictly, since CAB may not be equal to CBA. CAB is computed from the formula
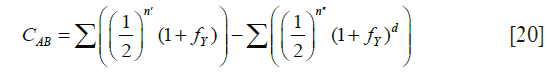
The first sum is over all chains through ancestors common to A and B linking A to each of the parents of B, where for each path n' is the inclusive number of individuals in a chain joining A and the particular parent of B. The term fY represents the coefficient of inbreeding of Y. The second sum is over all “double” paths joining A to the two parents of B and “forking” either from individual Y who is also a common ancestor of the parents of B, as well as of A, or a descendant of Y. The second term is a correction for double counting and can be ignored for present purposes.
Figure 3 is a hypothetical pedigree showing a couple of first cousins with an affected son and three non-affected children. The coefficient of common identity is applicable if we fix attention on the affected offspring. To calculate the requisite probability for the pedigree, set out the chains of ancestry. For individual IV-1, these are:

- III-1 ~ II-2 ~ I-1 ~ II-3;
- III-1 ~ II-2 ~ I-2 ~ II-3.
We know that IV-1 has a copy of the mutant gene drawn at random from his father. We require the probability that it is present in his mother. (A) The probability that II-2 transmits to III-1 the gene which he received from I-1 is ½; the probability that III-1 transmits the same gene to IV-1 is ½; the probability that I-1 transmits to II-3 a copy of the gene which went to II-2 is ½; the probability that II-3 transmits to III-2 the gene which he received from I-1 is ½; therefore the joint probability of these events is (½)4. (B) The same reasoning applies to transmission starting from I-2. Therefore the probability that a gene drawn at random from IV-1 is present in III-2 is (½)3. We have ignored the possibility that both genes of I-1 are identical by descent from an ancestor, which may be denoted by fI-1, which contributes a factor 1+ fI-1 to the result from (A); a corresponding reasoning applies to (B), and we may take fI-2 = fI-1. Having calculated CIV-1 III-2 = (½)3, this must be multiplied by ½, which is the probability that III-2 transmits the gene which she received from her father, yielding (½)4 as the probability that the genes of IV-1 are identical by descent.
In principle, the milieu of inbreeding in a population is relevant when computing the risk of inheriting the disorder. As we have seen, the frequency of the mutant depends in part on F. As noted above, the value of fY in Eq. [20], which will be a small positive quantity in most populations, increases CAB and may be neglected.
The paradoxical revelation of the preceding calculations is that, while consanguineous union increases the probability that a child will be affected, at the level of the population, the frequency of the mutant gene is lowered as a result of Darwinian selection.
Darvish et al. state that the “birth prevalence” of primary (at birth) microcephaly (MCPH) varies from 1.3 to 150 per 100,000 live births, depending on the population and defined SD threshold, with ~1 in 10,000 in consanguineous populations, less in non-consanguineous populations (7). This is an imprecise statement since it does not specify the value of F, which varies across populations, with consequent variation in mutant gene frequency.
Evolutionary considerations
Fisher speculated about the process that gives rise to the phenomenon of dominance in a population (8). He was motivated by observations on mutation coming from research on Drosophila melanogaster, but assumed his theory could be applied generally. Fisher’s imaginative approach used a blend of numerical assumptions combined with asymptotic argument. Presumably, his appeal to processes starting many generations earlier may be applied to the future, which has public health relevance. His equations echo ideas presented above in different notation.
It is convenient to use Fisher’s notation:
- k, mutation rate from wild type;
- p, frequency of mutant allele;
- v, viability of heterozygote as compared to the wild type (homozygote);
- w, viability of the mutant homozygote.
Fisher assumes that mating is at random, at least in the sense that the choice of mate is not affected by the gene in question. Then the relative frequencies of types are p2, 2p, 1. Then, assuming that k is of the order of 10−6, in the long run

Even if v is moderate, the heterozygote is many times more frequent than the mutant homozygote, leading to the conclusion that any selection of modifiers will be determined by the reaction of the heterozygote. Fisher says that other hereditary factors, not the mutant gene, will be modified by selection, leading to dominance of the wild type.
If the stage is reached at which the heterozygote survives as well as the wild type, the condition of equilibrium corresponding to Eq. [21] is

Eqs. [21] and [22] express balance between selection and mutation.
Thornton and Woods discuss mutation in MCPH genes and the evolution of relative brain size from monkeys to apes to humans (3).
Discussion
Penrose writes with authority based on his work at Royal Eastern Counties’ Institution, Colchester, England (9): “The cause of congenital diseases can only be said to be understood when the genetic units which underlie them can be specified, and the reaction of the organism as a whole to these genetic peculiarities observed. … The only effective way to study germ plasm in human beings is to investigate families, …”. Recent successes in explaining the various causes of microcephaly suggest that a direct attack using molecular methodology is permitting less reliance on laborious analysis of data from family studies.
Lupski et al. give a comprehensive overview of modern diagnostic techniques using whole-genome sequencing (10). They give a glossary of relevant terms which defines ‘Mendelian disease’ as “Human disease caused by mutations in a single gene”. The focus of their study is adult-onset Charcot-Marie-Tooth disease. Individuals so diagnosed can be explained by various modes of inheritance. In the family which they report, four of eight sibs exhibited recessive Charcot-Marie-Tooth type 1 phenotype because they inherited the same two (different) alleles that are as compound heterozygous mutations. This is analogous to the study of Murdock et al. (11).
Unlike many reports of recessive inheritance, including some mentioned here, the parents of the eight sibs in the Lupski study were not related.
Bilgüvar et al. applied whole-exome sequencing to the index case of a small consanguineous kindred from eastern Turkey (12). This patient, who was found on clinical examination to have microcephaly, was homozygous for a mutation in WDR62. This led to studies of more probands with similar initial diagnoses and who were products of consanguineous unions. The finding that there is a wide range of cortical malformations associated with WDR62 mutations led to studies of the developing mouse brain.
Roberts et al. followed the evidence that most cases of primary microcephaly are likely to be autosomal recessive, with an incidence of approximately 1 in 30,000 to 1 in 250,000 (13). They studied two consanguineous families of Northern Pakistani origin. They found a (second) primary microcephaly locus (MCPH2) on chromosome 19q13.1-13.2. They point out the benefit of confirmatory diagnosis and subsequent prenatal diagnosis.
Nicholas et al., using the families of Roberts et al., identified the MCPH2 gene to be WDR62 (14). They concluded that WDR62 is the second commonest form of MCPH.
Because of the diverse phenotypes of WDR62, Yu et al. suggest that it has a central role in many aspects of cerebral cortical development (15). They give pedigrees of six consanguineous families from Mexico, Turkey and Saudi Arabia.
Gul et al. present four pedigrees of consanguineous families, the first of which has a sibship with first cousin parents; four of the six children are affected with mild to moderate mental retardation and sloping forehead (16). The mutation is missense in exon 23 of the ASPM gene. They state that mutations in ASPM are the most common cause of MCPH in Pakistan and other world populations, including those of Turkey, Yemen, Saudi Arabia, Jordan, the Netherlands, and India. Thornton and Woods classify gene ASPM as MCPH5 (chromosome location 1q31.3), so, strictly speaking, it is outside of our main focus (3).
As noted earlier, Penrose states that the gene frequency of recessive true microcephaly in the Swedish population has been estimated as between 1/162 and 1/230 (1). These values are two or three times the range of gene frequencies displayed in Figure 2. Hussain et al. state that there are seven known loci for MCPH (17).
Komai et al. made a detailed study of microcephaly incorporating methodology from pioneers of genetic epidemiology including Dahlberg, Haldane, Hogben, Li, Neel, and Penrose (18). They give the following formula for mutation rate which they attribute to Li and Neel:

where m stands for mutation rate, f the relative fertility of the patients, q the gene frequency, and α the mean coefficient of inbreeding. They suggest several plausible values of the various parameters, deriving a tentative estimate of m in the interval 2.20×10⁻⁵–7.57×10⁻⁵. Since their estimates are based on cases arising from several kinds of recessive inheritance, these values are consistent with the mutation rate used to draw Figure 2.
>Eq. [23] assumes an equilibrium between selection and mutation: the first factor on the right is the proportion of the affected not reproducing; the second term consists of the proportion who are affected by virtue of having mutant genes identical by descent and the remainder by virtue of mutant genes uniting by chance.
Komai et al. found a significant preponderance of male cases in their data, as did Penrose in his Colchester study.
Morton et al. reanalysed the data used by Penrose for his Colchester study of mental defect (19). They estimated that at least 351 autosomal loci can produce mental retardation, with a mutation rate of 0.008 per gamete, or less than 2.4×10⁻⁵ per locus. They found that about one third of probands could be classed as ‘biological’ and that simple genetic mechanism α accounts for virtually all of these categories. Comparison between this study and later ones highlights the precision that is now provided by the new technology.
Brown and Meloche suggest that exome sequencing will be useful for diagnosing brain formation disorders such as polymicrogyria, citing Murdock et al. (11,20).
There does not appear to be an accurate estimate of the mutation rate μ of the disorder which has been the focus of this paper. Assume that it is 5×10⁻⁶ and that none of the affected reproduce, that is s =1. If the general level of inbreeding F is known, then an equilibrium value of the gene frequency q can be calculated from Eq. [19]. The incidence of microcephaly in the general population can be calculated from q2 + Fq (1– q), and the probability that a child of a consanguineous couple is affected is q2 + αq (1– q), where α is the coefficient of inbreeding applying to children of the couple. The ratio of the second to the first of these quantities is the relative risk and is illustrated by Figure 4. It is important to keep in mind that these values assume a state at or near equilibrium.

Acknowledgements
None.
Footnote
Conflicts of Interest: The author has no conflicts of interest to declare.
References
- Penrose LS. editor. The Biology of mental defect. 4th edition. London: Sidgwick and Jackson, 1972:84.
- Penrose LS. editor. Colchester Survey: A clinical and genetic study of 1,280 cases of mental defect. London: Institute for Research into Mental and Multiple Handicap, 1975:159.
- Thornton GK, Woods CG. Primary microcephaly: do all roads lead to Rome? Trends Genet 2009;25:501-10. [Crossref] [PubMed]
- Stark AE. Estimation of divergence from Hardy-Weinberg form. Twin Res Hum Genet 2015;18:399-405. [Crossref] [PubMed]
- Carter CO. editor. Human Heredity. Second edition. London: Penguin, 1977.
- Stark AE, Otto PA. The coefficient of common identity. Rev Brasil Genet 1987;10:301-11.
- Darvish H, Esmaeeli-Nieh S, Monajemi GB, et al. A clinical and molecular genetic study of 112 Iranian families with primary microcephaly. J Med Genet 2010;47:823-8. [Crossref] [PubMed]
- Fisher RA. The possible modification of the response of the wild type to recurrent mutations. Am Nat 1928;62:115-26. [Crossref]
- Penrose LS. Some genetical problems in mental deficiency. J Mental Sci 1938;84:1-15.
- Lupski JR, Reid JG, Gonzaga-Jauregui C, et al. Whole-genome sequencing in a patient with Charcot-Marie-Tooth neuropathy. N Engl J Med 2010;362:1181-91. [Crossref] [PubMed]
- Murdock DR, Clark GD, Bainbridge MN, et al. Whole-exome sequencing identifies compound heterozygous mutations in WDR62 in siblings with recurrent polymicrogyria. Am J Med Genet A 2011;155A:2071-7. [Crossref] [PubMed]
- Bilgüvar K, Oztürk AK, Louvi A, et al. Whole-exome sequencing identifies recessive WDR62 mutations in severe brain malformations. Nature 2010;467:207-10. [Crossref] [PubMed]
- Roberts E, Jackson AP, Carradice AC, et al. The second locus for autosomal recessive primary microcephaly (MCPH2) maps to chromosome 19q13.1-13.2. Eur J Hum Genet 1999;7:815-20. [Crossref] [PubMed]
- Nicholas AK, Khurshid M, Désir J, et al. WDR62 is associated with the spindle pole and is mutated in human microcephaly. Nat Genet 2010;42:1010-4. [Crossref] [PubMed]
- Yu TW, Mochida GH, Tischfield DJ, et al. Mutations in WDR62, encoding a centrosome-associated protein, cause microcephaly with simplified gyri and abnormal cortical architecture. Nat Genet 2010;42:1015-20. [Crossref] [PubMed]
- Gul A, Hassan MJ, Mahmood S, et al. Genetic studies of autosomal recessive primary microcephaly in 33 Pakistani families: Novel sequence variants in ASPM gene. Neurogenetics 2006;7:105-10. [Crossref] [PubMed]
- Hussain MS, Baig SM, Neumann S, et al. A truncating mutation of CEP135 causes primary microcephaly and disturbed centrosomal function. Am J Hum Genet 2012;90:871-8. [Crossref] [PubMed]
- Komai T, Kishimoto K, Ozaki Y. Genetic study of microcephaly based on Japanese material. Am J Hum Genet 1955;7:51-65. [PubMed]
- Morton NE, Rao DC, Lang-Brown H, et al. Colchester revisited: a genetic study of mental defect. J Med Genet 1977;14:1-9. [Crossref] [PubMed]
- Brown TL, Meloche TM. Neurological disorders, genetic correlations, and the role of exome sequencing. J Transl Sci 2016;2:107-12. [Crossref]

