
Analysis of the height dependence of site-specific cancer risk in relation to organ mass
Introduction
Cancer risks at many cancer sites have shown positive correlations with height for both men and women of different countries (1-15). There have been several reviews on the height dependence of cancer risks (16,17). However, the reasons for the height dependences are not clear. Hypotheses that have been suggested include the number of proliferating cells and organ size (16,18-20), insulin-like growth factor 1 (16,17,19,20), nutrition in childhood (17), genetic factors (16,17), and hormones (17,20). One of the suggestions is based on the expectation that taller people have more cells and thus are more susceptible to mutations that will lead to cancer. In particular, it has been pointed out that one may expect an association between relevant organ mass and site-specific cancer (19), assuming that the number of susceptible cells is proportional to the organ mass. Recently we have constructed a general model of radiation-induced cancer risk and predicted that the excess cancer risk induced by low dose radiation is directly proportional to the organ mass (21). In this study we use the height dependence of cancer incidence to quantitatively test the hypothesis that cancer risk is proportional to the organ mass. Specifically, we compare large-scale data on the height dependence of cancer risk at different cancer sites with the expectation based on the height dependence of the measured organ mass.
Methods
We first gather large-scale data on the height dependence of adult cancer risks at various cancer sites, regardless of countries of origin. In this study, the height dependence is represented by the relative risk (RR) per 10 cm increase in height, denoted as RR10cm, for cancer incidence at a given cancer site. The five sets of cancer data used in this study include set (I) the Million Women Study in the United Kingdom (1), set (II) Norwegian men and women (2-12), set (III) Korean men and women (13), set (IV) postmenopausal women in the United States (14), and set (V) Canadian women (15). Each set of these selected data has more than 5,000 total cancer incidences and either provides RR10cm values or contains enough information for us to estimate RR10cm values for specific cancer sites. These cancer incidence data cover 16 cancer sites of women and 13 cancer sites of men. Some data (1,14,15) include both non-Hodgkin lymphoma and multiple myeloma, and we include both of them under “Lymphoma”.
We take the cancer risk data that have been adjusted for variables such as age and body mass index (BMI) whenever available. For the data set on Korean men and women (13), we take the “reproductive factor adjusted” data when available and take the “fully adjusted” data otherwise. For the data sets on postmenopausal women in the US (14) and on Canadian women (15), we take the “HR3” data that are multivariable-adjusted including BMI. When data is reported as the RR per 5 cm increase (13) or 15 cm increase (2) in height, we convert the reported RR and confidence interval (CI) into those per 10 cm increase in height by assuming that the logarithm of RR is proportional to height (1). For example, we convert the RR and 95% CI per 5 cm increase in height to those per 10 cm increase using the following relations:

where ΔCI represents the width of the CI. As an example, the RR value of 1.18 for breast cancer per 5 cm increase with 95% CI 1.11–1.25 (13) is converted to RR10cm of 1.39 with the 95% CI 1.23–1.56. Also, using the breast cancer data of Norwegian women [(2), Table IV], we first obtain the average RR per 15 cm increase in height (1.39 with the 95% CI 1.30–1.47) by averaging over the RR values of different age groups using the number of cancer cases as the weight, and then we convert it into RR10cm of 1.24 with the 95% CI 1.19–1.30. Some Norwegian data (4-6,8,9) do not provide RR values for a given increase in height; instead they provide the RR values of different height groups relative to a referent height group. In those cases we estimate the RR10cm values. We first assume that the height distributions of Norwegian men and women in the surveys follow the normal distribution with the mean height of 176 and 163 cm, respectively. The standard deviation in height is taken as 6.8 and 6.0 cm respectively for Norwegian men and women in the data, assuming that the ratios of the standard deviation over the mean height are the same as those for Dutch young adults at 21 years of age (22), which is expected if the height distribution has the same shape despite having a different mean value. We then calculate the mean heights of different height groups and estimate the RR10cm value and its CI. Note that all error bars shown in the figures represent the 95% CI of RR10cm. When the original data provide the 99% CI (1), we multiply the 99% CI width by a factor of 0.76 to obtain the 95% CI.
Secondly, we find the following sets of organ mass measurements versus height for the relevant organs: set (I) brain data from 4,488 males and 3,477 females (23), set (II) data from 355 males and 329 females in the Caucasian population (24,25), set (III) data from 914 males and 308 females in Tehran’s population (26), set (IV) data from 269 males and 230 females in the Thai Population (27), set (V) ovarian data from 58,673 women in the US (28), and set (VI) prostate data from 380 men in the US (29). Note that, since our hypothesis that cancer risk is proportional to the organ mass refers to a normal organ before the cancer initiation, organ mass in this study refers to the mass of a normal organ, not the cancerous organ mass in a cancer patient. These data (23-29) cover 8 organs of women and 8 organs of men: pancreas (24,26,27), lungs (24,26,27), uterus (26,27), ovaries (26-28), kidneys (24,26,27), liver (24,26,27), brain (23,26,27), thyroid (24,26,27), prostate (26,29), and testes (25-27). Two of these data sets (28,29) provide the organ volume data instead of organ mass; we assume the organ volume to be proportional to the organ mass (i.e., assuming the same organ mass density) in order to extract the height dependence of the organ mass from these two sets. In particular, we use the prostate volume values associated with height in a multivariable model for 380 biopsy-negative subjects (29). In addition, we use the height and brain mass values in a human phantom model (30), which has incorporated the brain data of set I (23). Note that ethics approval was not required as this study is based on published data.
Our hypothesis, that cancer risk is proportional to the organ mass, then allows us to convert the height dependence of these organ mass data into the expected height dependence of cancer risk. For a given organ, we first fit each set of the organ mass data as an exponential function of body height h, i.e., as being proportional to exp(α h). Therefore the height dependence of the organ mass data is represented by the fit value of the exponent α, which depends on the data set and organ. For a given organ in a given set of organ mass data, we use 1/SEM2 as the weight of each height group in the fit, where SEM refers to the Standard Error of the Mean organ mass of each height group. The human phantom model (30) does not provide SEM values, thus the brain masses at different heights are weighed equally in that fit. Furthermore, some sets of organ mass data (28,29) do not provide the average heights of each height group; then we assume a normal height distribution with the mean height of 177 and 163 cm respectively for US men (29) and women (28) in those data. Using the fit α value for a given organ from a given set of organ mass data, we then obtain the individual expected value of RR10cm as

according to our hypothesis. These individual fit values of exponent α are listed in Table 1, where N/A means that the organ is not applicable to the gender.

Full table
To compare the cancer risk data with the expected RR10cm values, we also average over individual RR10cm data (and individual expected RR10cm values) for each organ. The averaged RR10cm data for an organ is obtained by averaging over individual RR10cm data from the multiple sets of cancer risk data, using the number of cancer incidence of each set as the weight. The 95% CIs of the averaged RR10cm data are similarly calculated. On the other hand, the averaged expected value of RR10cm for an organ is obtained by averaging over individual expected RR10cm values from the multiple sets of organ mass measurements, using the number of organ samples of each set as the weight.
Results
Cross symbols in Figure 1A show the 66 individual cancer risk data points on RR10cm with 95% CIs for 16 cancer sites of women. For a given site or organ, the RR10cm value from each set of the cancer risk data is shown with a different horizontal offset from the center position for that organ, which is represented by the tick mark on the horizontal axis above the organ name. Several sites including colon, breasts, uterus, ovaries, and lymphoma each contain all five sets of the cancer risk data; each of these sites shows data at five equally-spaced horizontal positions around the center position of the site, where the left-most data point corresponds to cancer data set I (1) while the right-most data point corresponds to cancer data set V (15). Note that the lung cancer data from two data sets (14,15) are shown separately for never-smokers and ever-smokers, and the breast cancer data from one data set (15) are shown separately for premenopausal and postmenopausal women. In addition, data for cervix uteri and corpus uteri are shown separately for each of the three sets of uterus data (13-15), and data for non-Hodgkin lymphoma and multiple myeloma are shown separately for each of the three data sets (1,14,15). We see that most sites have cancer risk data from multiple data sets, and the multiple data points for the same cancer site are consistent with each other in that their 95% CIs all have overlap with each other (except for a couple of data points for breasts, uterus and thyroid).

For comparison, Figure 1A also shows the 23 individual expected RR10cm values for 8 cancer sites of women, for which we found measured organ mass data versus height. Different symbols other than the cross symbols represent the expected RR10cm values from different sets of the organ mass data (23,24,26-28). There are multiple expected values for each of the 8 cancer sites, and these expected values for the same cancer site can be rather different. A few individual expected RR10cm values, such as the lowest value for kidneys, liver and thyroid, are outside the 95% CI of every cancer risk data point for the corresponding organ; thus they are apparently inconsistent with the cancer risk data.
Figure 1B shows the averaged cancer risk data in comparison with the averaged expected values of RR10cm for women. Note that the range of RR10cm values in Figure 1B is much smaller than that in Figure 1A due to better statistics. We see that the averaged expected RR10cm is within the 95% CI of the averaged cancer risk data for 3 cancer sites (pancreas, liver and brain); while it is outside the 95% CI of the averaged cancer risk data for the other 5 cancer sites (lungs, uterus, ovaries, kidneys, and thyroid) for which we have found both cancer risk data and organ mass data. The disagreement is especially significant for uterus, kidneys and thyroid.
Figure 2A shows 18 individual cancer risk data points with 95% CIs for 13 cancer sites of men. For a given organ, the RR10cm value from cancer risk data set II (3-12) is shown at the center position for that organ, while the RR10cm value from cancer risk data set III (13) is shown slightly to the right. Figure 2A also shows 23 individual expected values of RR10cm from different sets of the organ mass data (23-27,29) for 7 cancer sites of men. Several individual expected RR10cm values, such as all the values for kidneys and the lowest value for thyroid and prostate, are outside the 95% CI of every cancer risk data for the corresponding organ and thus apparently inconsistent with the cancer risk data.

Figure 2B shows the averaged cancer risk data with 95% CIs in comparison with the averaged expected values of RR10cm for men. Out of the 7 cancer sites for which we have found both cancer risk data and organ mass data, the averaged expected RR10cm value is within the 95% CI of the averaged cancer risk data for 5 cancer sites (pancreas, lungs, liver, thyroid, and testes); while it is outside the 95% CI of the averaged cancer risk data for the other 2 cancer sites (kidneys and prostate).
We compare in Figure 3 the averaged cancer risk data against the averaged expected values of RR10cm for both women and men. The averaged cancer risk data on RR10cm with 95% CIs are also listed in Table 2. Note that the cancer risk data used in this study do not cover men’s breasts, bladder and brain (labeled “N/D” in Table 2). For all other shared cancer sites except for lungs, the averaged cancer risk data for women (star symbol with solid line for 95% CI) and men (cross symbol with dashed line for 95% CI) have overlapping 95% CIs (when both are available), indicating that the height dependences of the cancer risk for women and men are not significantly different from each other within the statistics of existing data for those cancer sites. From Figure 3 we see that the averaged expected values of RR10cm are within the 95% CI of the averaged cancer risk data for both women and men for two sites (pancreas and liver), while the averaged expected values for kidneys are outside the 95% CI of the cancer risk data for both women and men. In addition, the averaged expected value of RR10cm is within the 95% CI of the averaged cancer risk data for lungs, thyroid and testes of men and brain of women; while it is outside the 95% CI of the cancer risk data for lungs, uterus, ovaries, thyroid of women, and prostate of men. Overall, the averaged expected RR10cm value is within the 95% CI of the averaged cancer risk data for 8 out of the 15 cancer sites where the comparison can be made.


Full table
It has been suggested that height difference between men and women contributes to the sex difference of cancer risks (20,31). For example, a recent study (31) finds that, while the total shared-site cancer risk for men is about 55% higher, roughly a third of the excess cancer risk can be explained by the height difference. Under the hypothesis that cancer risk is proportional to the organ mass that correlates with height, we can evaluate the consequence of different organ masses between men and women on the sex difference of cancer risks. According to our hypothesis, the expected male to female ratio of cancer risk due to organ mass alone is simply the male to female ratio of the organ masses. Since the cancer risk population may have a different average height from the people that contribute the organ samples, we also need to adjust for this height difference as
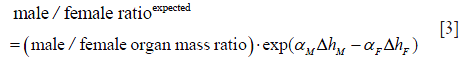
where ΔhM and ΔhF are the height difference between the cancer risk population and the organ contributors for male and female respectively, while αM and αF are the fit α value of the organ mass data set for male and female respectively (as listed in Table 1).
Figure 4 shows recent data on the male/female cancer risk ratio [2007-2011] (32) from the Surveillance, Epidemiology, and End Results (SEER) registry of the US National Cancer Institute. Since the SEER data cover the US population, we use organ mass data set I from Switzerland (23) and set II for the Caucasian population (24,25) for comparisons. Only shared sites with these organ mass data are shown, including lungs and bronchus (labeled as “Lungs*” in Figure 4), kidney and renal pelvis (“Kidneys*”), and liver and intrahepatic bile duct (“Liver*”). Since we take the mean height of 177 and 163 cm respectively for US men and women, but the mean height for organ mass data set II (24) is 172 and 161 cm respectively for men and women, we use ΔhM=5 cm and ΔhF=2 cm in the Eq. [3]. The brain mass data from set I does not provide average heights; therefore no height adjustment is made. Note that there are two expected values for lungs (and for kidneys) since we use the left and right organ mass separately to extract the height dependences.

From Figure 4 we see that the organ mass difference can explain a large proportion (61% to 74%) of the excess cancer risk of pancreas and lungs for men, while it can explain a small proportion (22% to 25%) of the excess cancer risk of kidneys and brain for men. Note that Figures 1,2,3 show a similar pattern, since the expected height dependence RR10cm from organ mass set II (for both women and men) is mostly consistent with the averaged cancer risk data for pancreas and lungs while underestimates the averaged cancer risk data for kidneys. For liver and thyroid, the consequence of different organ masses on the excess cancer risk is either very small or in the opposite direction, suggesting that the excess cancer risks there are dominated by sex difference in the baseline cancer risk that is not associated with the organ mass.
We obtain the expected height dependence of cancer risk for a cancer site from the height dependence of the measured organ mass. Since organ mass depends not only on height but also on age and BMI (or weight), the organ mass data need to be adjusted for these dependences. However, only organ mass data set VI on prostate (29) has included these adjustments. Adjustments for age and BMI dependences will affect the extracted height dependence of the organ mass and consequently the expected value of RR10cm. For example, organ mass data set III for Tehran’s population (26) shows a strong increase of the prostate mass with age. If one assumes that taller people tend to be younger (1,3) in that data set, adjusting for age would lead to a stronger height dependence of the prostate mass, and the expected RR10cm for prostate from organ mass set III (currently at RR10cm=1.01) would be higher. Organ mass data set III (26) also shows an overall strong decrease of the ovarian mass with age, and adjusting for age would lead to a weaker height dependence of the ovarian mass, thus the expected RR10cm for ovaries from organ mass set III (currently at RR10cm=1.24) would be lower. Therefore for more reliable comparisons we would need all organ mass data to be adjusted for dependences on age and BMI (or weight). Also note that we have not extracted expected RR10cm values for the most common type of cancer: breast cancer of women. This is because the mammary gland mass is expected to be closely associated with the breast cancer risk (33,34), but we have not found data of mammary gland mass vs. height.
As a simple estimate, the dashed line in Figure 1B and Figure 2B represents the naive expectation of the RR10cm value for women and men, respectively, if the mass of each organ were proportional to the body weight at a fixed BMI. For example, for two groups of women with the same BMI but different average heights, one group at 170 cm and another at 160 cm, the ratio of the average body weights is then the height ratio squared: (170/160)2=1.13. If the mass of each organ at the same BMI would be proportional to the body weight, the organ masses of the two groups would also be related by this ratio, thus we would expect RR10cm to be 1.13. Similarly, for two groups of men with the same BMI but different average heights, one group at 180 cm and another at 170 cm, we would expect RR10cm to be (180/170)2=1.12. Since the mass of each organ scales differently with the body weight, these naive expectations cannot be correct for every organ; however, they provide a crude estimate of the overall RR10cm value to be expected from the organ mass hypothesis. Similarly, the dashed line in Figure 4 represents the naive expectation of the male/female ratio of the cancer risk, which is the male/female ratio of the average body weight at the same BMI: (177/163)2=1.18. We see that this naive expectation in Figure 4 is rather close to the expected values extracted from the organ mass data.
This study investigates the height dependence of cancer risks that is expected from the hypothesis that cancer risk is proportional to the organ mass, i.e. organ mass is a multiplicative factor in calculating the cancer risk. Other factors such as cell proliferation, nutrition and genetic factors may affect both height and cancers risks, therefore they may also contribute to the height dependence of cancer risks. Furthermore, the cancer risk data and the organ mass data used in this study come from multiple countries including those in Asia, Europe and North America. However, there could be differences among populations of different countries (35), and similar analysis as this study can be performed when there are sufficient country-specific data.
Conclusions
We have quantitatively tested the hypothesis that cancer risk is proportional to the organ mass by studying their height dependences. For the RR per 10 cm increase in height for cancer incidence, we find that the expected value is within the 95% CI of the averaged cancer risk data for 8 out of the 15 cancer sites for which the comparison can be made. This indicates that the height dependence of cancer risks can be partially explained by the hypothesis. We also find that the hypothesis helps explain the sex difference of cancer risks, especially for pancreas and lungs.
Acknowledgements
The author is grateful to Dr. Anders Engeland (Norwegian Institute of Public Health and University of Bergen, Norway) for correspondence about the Norwegian cancer risk data.
Footnote
Conflicts of Interest: The author has no conflicts of interest to declare.
References
- Green J, Cairns BJ, Casabonne D, et al. Height and cancer incidence in the Million Women Study: prospective cohort, and meta-analysis of prospective studies of height and total cancer risk. Lancet Oncol 2011;12:785-94. [Crossref] [PubMed]
- Tretli S. Height and weight in relation to breast cancer morbidity and mortality. A prospective study of 570,000 women in Norway. Int J Cancer 1989;44:23-30. [Crossref] [PubMed]
- Engeland A, Bjørge T, Selmer RM, et al. Height and body mass index in relation to total mortality. Epidemiology 2003;14:293-9. [Crossref] [PubMed]
- Engeland A, Tretli S, Bjørge T. Height, body mass index, and prostate cancer: a follow-up of 950000 Norwegian men. Br J Cancer 2003;89:1237-42. [Crossref] [PubMed]
- Engeland A, Tretli S, Bjørge T. Height, body mass index, and ovarian cancer: a follow-up of 1.1 million Norwegian women. J Natl Cancer Inst 2003;95:1244-8. [Crossref] [PubMed]
- Engeland A, Tretli S, Bjørge T. Height and body mass index in relation to esophageal cancer; 23-year follow-up of two million Norwegian men and women. Cancer Causes Control 2004;15:837-43. [Crossref] [PubMed]
- Bjørge T, Tretli S, Engeland A. Relation of height and body mass index to renal cell carcinoma in two million Norwegian men and women. Am J Epidemiol 2004;160:1168-76. [Crossref] [PubMed]
- Engeland A, Tretli S, Austad G, et al. Height and body mass index in relation to colorectal and gallbladder cancer in two million Norwegian men and women. Cancer Causes Control 2005;16:987-96. [Crossref] [PubMed]
- Bjørge T, Tretli S, Lie AK, et al. The impact of height and body mass index on the risk of testicular cancer in 600,000 Norwegian men. Cancer Causes Control 2006;17:983-7. [Crossref] [PubMed]
- Engeland A, Tretli S, Akslen LA, et al. Body size and thyroid cancer in two million Norwegian men and women. Br J Cancer 2006;95:366-70. [Crossref] [PubMed]
- Bjørge T, Engeland A, Tretli S, et al. Body size in relation to cancer of the uterine corpus in 1 million Norwegian women. Int J Cancer 2007;120:378-83. [Crossref] [PubMed]
- Engeland A, Tretli S, Hansen S, et al. Height and body mass index and risk of lymphohematopoietic malignancies in two million Norwegian men and women. Am J Epidemiol 2007;165:44-52. [Crossref] [PubMed]
- Sung J, Song YM, Lawlor DA, et al. Height and site-specific cancer risk: A cohort study of a korean adult population. Am J Epidemiol 2009;170:53-64. [Crossref] [PubMed]
- Kabat GC, Anderson ML, Heo M, et al. Adult stature and risk of cancer at different anatomic sites in a cohort of postmenopausal women. Cancer Epidemiol Biomarkers Prev 2013;22:1353-63. [Crossref] [PubMed]
- Kabat GC, Heo M, Kamensky V, et al. Adult height in relation to risk of cancer in a cohort of Canadian women. Int J Cancer 2013;132:1125-32. [Crossref] [PubMed]
- Gunnell D, Okasha M, Smith GD, et al. Height, leg length, and cancer risk: a systematic review. Epidemiol Rev 2001;23:313-42. [Crossref] [PubMed]
- Batty GD, Shipley MJ, Gunnell D, et al. Height, wealth, and health: an overview with new data from three longitudinal studies. Econ Hum Biol 2009;7:137-52. [Crossref] [PubMed]
- Albanes D, Winick M. Are cell number and cell proliferation risk factors for cancer? J Natl Cancer Inst 1988;80:772-4. [Crossref] [PubMed]
- Trichopoulos D, Lipworth L. Is cancer causation simpler than we thought, but more intractable? Epidemiology 1995;6:347-9. [Crossref] [PubMed]
- Cairns BJ, Green J. Good news for "Alice": height and sex differences in cancer risk. J Natl Cancer Inst 2013;105:841-3. [Crossref] [PubMed]
- Lin ZW. Cancer risk from low dose radiation depends directly on the organ mass in a general model of radiation-induced cancer risk. Health Phys 2014;106:459-65. [Crossref] [PubMed]
- Schönbeck Y, Talma H, van Dommelen P, et al. The world's tallest nation has stopped growing taller: the height of Dutch children from 1955 to 2009. Pediatr Res 2013;73:371-7. [Crossref] [PubMed]
- Hartmann P, Ramseier A, Gudat F, et al. Normal weight of the brain in adults in relation to age, sex, body height and weight. Pathologe 1994;15:165-70. [Crossref] [PubMed]
- de la Grandmaison GL, Clairand I, Durigon M. Organ weight in 684 adult autopsies: new tables for a Caucasoid population. Forensic Sci Int 2001;119:149-54. [Crossref] [PubMed]
- Clairand I, Bouchet LG, Ricard M, et al. Improvement of internal dose calculations using mathematical models of different adult heights. Phys Med Biol 2000;45:2771-85. [Crossref] [PubMed]
- Sheikhazadi A, Sadr SS, Ghadyani MH, et al. Study of the normal internal organ weights in Tehran's population. J Forensic Leg Med 2010;17:78-83. [Crossref] [PubMed]
- Narongchai P, Narongchai S. Study of the normal internal organ weights in Thai population. J Med Assoc Thai 2008;91:747-53. [Crossref] [PubMed]
- Pavlik EJ, DePriest PD, Gallion HH, et al. Ovarian volume related to age. Gynecol Oncol 2000;77:410-2. [Crossref] [PubMed]
- Fowke JH, Motley SS, Cookson MS, et al. The association between body size, prostate volume and prostate-specific antigen. Prostate Cancer Prostatic Dis 2007;10:137-42. [Crossref] [PubMed]
- Cassola VF, Milian FM, Kramer R, et al. Standing adult human phantoms based on 10th, 50th and 90th mass and height percentiles of male and female Caucasian populations. Phys Med Biol 2011;56:3749-72. [Crossref] [PubMed]
- Walter RB, Brasky TM, Buckley SA, et al. Height as an explanatory factor for sex differences in human cancer. J Natl Cancer Inst 2013;105:860-8. [Crossref] [PubMed]
- Howlader N, Noone AM, Krapcho M, et al. SEER cancer statistics review, 1975–2011, National Cancer Institute. Bethesda, MD, 2014 (cited 2015). Available online: http://seer.cancer.gov/csr/1975_2011/
- Trichopoulos D, Lipman RD. Mammary gland mass and breast cancer risk. Epidemiology 1992;3:523-6. [Crossref] [PubMed]
- Swanson CA, Coates RJ, Schoenberg JB, et al. Body size and breast cancer risk among women under age 45 years. Am J Epidemiol 1996;143:698-706. [Crossref] [PubMed]
- Albanes D, Taylor PR. International differences in body height and weight and their relationship to cancer incidence. Nutr Cancer 1990;14:69-77. [Crossref] [PubMed]

