

High performance of intravoxel incoherent motion diffusion MRI in detecting viral hepatitis-b induced liver fibrosis
Introduction
Chronic liver disease is a major public health problem worldwide, accounted for approximately 1.3 million deaths worldwide in 2015 (1). Chronic liver disease causes include chronic viral hepatitis, alcohol, non-alcoholic fatty liver disease (NAFLD), hemochromatosis, alpha-1-antitrypsin deficiency, and cholestatic and autoimmune diseases. Viral hepatitis is the most common blood-borne infection worldwide. Regardless of the etiology, the end result of untreated chronic liver disease is inflammation, loss of liver parenchyma, and healing by fibrosis and regeneration. Clinically liver fibrosis usually has an insidious onset and progresses slowly over decades. The deposition of fibrosis in the liver is a slow and gradual process balanced with degradation of fibrosis by metalloproteinases and regeneration in the early stages. In untreated chronic liver disease, this process continues for years until when the degradation process fails and fibrosis progresses rapidly thereafter.
Originally considered to be irreversible, hepatic fibrosis is now regarded as a dynamic process with the potential for regression. Studies have demonstrated regression of liver fibrosis after treatment of the underlying pathology (2,3). Earlier stage liver fibrosis is more amenable to therapeutic intervention. The regression of liver fibrosis can be complete in early stages, whereas partial and prolonged recovery occurs in late or advanced stages (4). Treatment with combined therapies on underline etiology and fibrosis simultaneously might expedite the regression of liver fibrosis and promote liver regeneration. Even when the underline etiology of liver fibrosis could not be eradicated, therapies on liver fibrosis might help delay the progression of the disease to cirrhosis. Therefore, early detection and staging of liver fibrosis are important for early institution of treatment and assess potential for regression and prognosis. To date, the reference standard for detection and staging of liver fibrosis remains being biopsy, but it is invasive, and frequently causes pain and discomfort, with risk of bleeding and hospitalization and therefore not suitable for longitudinal monitoring.
Intravoxel incoherent motion (IVIM) reflects the random microscopic motion that occurs in voxels on MR images of water molecules (either intra-cellular or extracellular) and the microcirculation of blood. Le Bihan et al. (5-8) proposed the principle of IVIM which enables the quantitative parameters that separately reflect tissue diffusivity and tissue microcapillary perfusion to be estimated. Molecular water diffusion in fibrotic liver would be restricted by the presence of collagen fibers in the distorted lobular structure. Given the relatively high blood volume fraction of <25–30 mL of blood per 100g in liver (9), perfusion can contribute to the diffusion measurements significantly because of the incoherent motion of blood in pseudorandom capillary network at the macroscopic level. It is well accepted that liver fibrosis is associated with reduced liver perfusion (10-13), and progressive loss of endothelial fenestration and deposition of collagen in the space of Disse. These processes reduce the rate of blood flow and prolong its transit time. Recently there has been great interest of using IVIM technique to study diffused liver diseases such as liver fibrosis (14). In one our recent report (15,16), we demonstrated that a combination of PF, Dfast and Dslow, can be used to separate fibrotic livers from healthy livers. Since our recent report was based in a small cohort of patients (16 healthy volunteers and 33 hepatitis-b liver fibrosis patients) (15), hereby we performed a study with the aim to confirm our previous observation.
Methods
This is a prospective study with MRI data acquired at The Third People’s Hospital of Shenzhen, China. It was approved by the institutional ethical committee of The Third People’s Hospital of Shenzhen and the informed consent was obtained for all the subjects. Twenty-six healthy volunteers (14 males, 12 females, mean age: 24 yrs old; range: 20–41 yrs old) and 19 consecutive patients suspected of liver fibrosis with liver biopsy results were recruited. The data acquisition periods for healthy volunteer were July 27, 2017 to Aug 11, 2017 (n=10), and Oct 14, 2018 to Nov 2, 2018 (n=16). The data acquisition period for patients was Sep 17, 2017 to Oct 21, 2018. Liver biopsy and MRI were performed with less than one-month’s interval. Three patients had chronic viral hepatitis-b infection, but did not show liver fibrosis, and one patient’s biopsy result showed only mild simple steatosis (Figure S1). These four patients were all males, aged 19–57 yrs. The liver fibrosis patient cohort (mean age: 46 yrs, range: 22–62 yrs) had four stage 1 subjects, three stage 2 subjects, four stage 3 subjects, and one stage 4 subject, all with chronic viral hepatitis-b. One patient additionally had hepatocellular carcinoma. The histology diagnosis for liver fibrosis was based on the consensus of the 2000 Xi’an consensus of the Chinese Society of Infectious Disease and Parasitology and the Chinese Society of Hepatology (17), and being very similar to METAVIR score (18). Stage 1 liver fibrosis (F1) is mild fibrosis only seen at the portal area; stage 2 liver fibrosis (F2) indicates fibrosis extending out from the portal areas with rare bridges between portal areas, but without the destruction of the lobular structure; stage 3 liver fibrosis (F3) is severe fibrosis, there is fibrotic bridging between portal areas and between portal areas and center veins; and in stage 4 (F4, cirrhosis) there are pseudo-lobules formed.

MR imaging was performed with a 1.5-T magnet (Achieva, Philips Healthcare, Best, Netherlands). The IVIM diffusion imaging was based on a single-shot spin-echo type echo-planar sequence, with 15 b-values of 2, 0, 1, 15, 20, 30, 45, 50, 60, 80, 100, 200, 300, 600, 800 s/mm2. This b-values series was designed aiming to overcome the perceived shortcoming of our initial report where b =0 s/mm2 was not acquired (15), and the first b=2 s/mm2 was used as a pre-scan to stabilize magnetization. SPIR technique (Spectral Pre-saturation with Inversion-Recovery) was used for fat suppression. Respiratory-gating was applied in all scan participants and resulted in an average TR of 1,600 ms, and the TE was 63 ms. Other parameters included slice thickness =7 mm and inter-slice gap 1 mm, matrix =124×97, FOV =375 mm × 302 mm, NEX =2, number of slices =6.
As described in our report (19), we performed a data quality assessment prior to IVIM analysis. Eighteen and 8 volunteers’ data were classified to be good quality and fair quality respectively. Eight, 8, and 3 patients were classified to be good quality, fair quality and insufficient data quality respectively, with the later 3 patients’ data excluded for IVIM analysis (Figure S2).

For individual study subjects, poor image slices were additionally excluded, resulting a mean of 5.6 slices for volunteer and 4.9 slices for patients included for analysis. At least three fair quality slices were required to qualify for a subject’s inclusion in the analysis. No exclusion was made based on fitting curve appearances.
Regions-of-interests (ROIs) were placed to cover a large portion of right liver parenchyma while avoiding large vessels on b =15 s/mm2 image of the selected b-value image series, with large vessels locations checked on b =0 s/mm2 image. With the consideration of respiration induced position shift of the same slice data acquisition during different b-values, sufficient margins were allowed between the ROIs and the liver borders, large vessels and artifacts (Figure 1). ROIs were then copied and pasted on each corresponding image of each b-values. For ROI analysis, the IVIM parameters were calculated based on the mean signal intensity of the whole ROI, which offers better estimation than pixel-wise fitting when the signal-to-noise ratio (SNR) of images is low (20,21). The mean signal intensity of each ROIs was weighted by the number of pixels included in each ROI, then the average of the weighted mean signal intensity of individual slice’s ROIs was calculated to obtain the average signal value of the liver. All the study subjects’ results were measured twice by the same trained radiographer reader, and the resulting two measurements were used to assess intra-reader measurement reproducibility. The mean of the two measurements was then used as the result of the study subjects for further analysis.

Curve-fitting algorithms were implemented in a custom program developed on MATLAB (Mathworks, Natick, MA, USA). In our pilot IVIM data analysis, we used the 14 b-value series of 0, 1, 15, 20, 30, 45, 50, 60, 80, 100, 200, 300, 600, 800 s/mm2 for bi-exponential segmented fitting. It was found the fitting was unstable due to a lack of b-value points between b=1 s/mm2 and b=15 s/mm2. Later we shifted the b=2 s/mm2 image to the third place of diffusion imaging series (therefore 15 b-values for curve fitting, i.e., 15 b-values series = 0, 1, 2, 15…). It was found that, despite the addition of b-value =2 s/mm2 image, the fittings were still unstable, with large variations among healthy volunteers. Finally, it was decided to abandon the three images of b=0, 1, 2 s/mm2, and b=15 s/mm2 was used as the starting point for bi-exponential segmented fitting similar to our previous report (15,22). The signal value at each b-value was normalized by attributing a value of 100 at b=15 s/mm2 [Snorm = (SI/SI15) ×100, where Snorm is the normalized signal, SI=signal at a given b-value, and SI15 =signal at b=15 s/mm2]. The thresholds of b=60 and 200 s/mm2 were both tested for segmented fitting. For bi-compartmental model, the signal attenuation was modeled according to Eq. [1] (8):
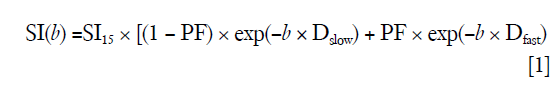
where SI(b) and SI15 denote the signal intensity acquired with the b-factor value of b and b =15 s/mm2, respectively (8).
The estimation of Dslow was obtained by a least-squares linear fitting of the logarithmized image intensity at the threshold b-values greater than 60 or 200 s/mm2 to a linear equation. The fitted line was then extrapolated to obtain an intercept at b=15 s/mm2, and the ratio between this intercept and SI15 gave an estimate of PF [figure 7 of reference (23)]. Finally, the obtained Dslow and PF were substituted into Eq. [1] and non-linear least-square fitted against all b-values to estimate Dfast using the Trust-Region algorithm.
For visual display, a three-dimensional tool was programed using IBM SPSS 23 for Windows (SPSS Inc., Chicago, IL, USA), and the measurements of Dslow, PF, and Dfast were placed along the x-axis, y-axis, and z-axis.
The correlations of PF vs. Dfast, Dslow vs. PF, and Dslow vs. Dfast were inspected graphically and Pearson correlation analysis was performed. For this purpose, the values of the three IVIM parameters were re-scaled, with the mean measures of PF, Dslow, and Dfast for all patients (n=16) re-scaled to be 1.
Results
The intraclass correlation coefficient (ICC) of intra-reader agreement was 0.925 for PF, 0.949 for Dfast, and 0.909 for Dslow respectively (individual’s measurement results shown in Tables S1,S2). The Coefficient of variances, (CoVs, standard deviation/mean) for PF, Dfast and Dslow in healthy volunteers for the first measurements when threshold b=60 s/mm2, and for the means of the two measurements for threshold b=60 or 200 s/mm2 are shown in Table 1. The mean of the two measurements for threshold b-value of 60 s/mm2 showed smallest CoV and the measurements of threshold b-value of 200 s/mm2 showed largest CoV, such favoring threshold b-value of 60 s/mm2 and measuring twice.

Full table

Full table

Full table
The results by using b-value threshold of 60 or 200 s/mm2 for the healthy volunteers, patients without fibrosis, and patients with liver fibrosis are shown in Table 2, and scattered plots for results of using b-value threshold of 60 or 200 s/mm2 are shown in Figures 2 and 3. A comparison of Figure 2 and Figure 3 indicated the superiority of using threshold of 60 s/mm2 compared with b-value threshold of 200 s/mm2 for separating healthy volunteers and patients. Figure 2 shows PF offered best differentiation of the three groups, followed by Dfast. Table 2 shows smaller pts/vols ratio (mean measurement for patients divided by the mean measurement for healthy volunteers) for all the three parameters when b-value threshold of 60 s/mm2 was used as compared with when b-value threshold of 200 s/mm2 was used, therefore favoring b-value threshold of 60 s/mm2. Classification and regression tree (CART) model showed when threshold b-value =60 s/mm2 was applied, PF (PF <6.49%) could differentiate healthy livers and all fibrotic livers with 100% sensitivity and specificity.

Full table


By adjusting the viewing angle, the 3-dimensional visual tool demonstrated healthy volunteers and all patients with liver fibrosis could be separated (Figures 4,5). Notably the IVIM measures of the four patients without fibrosis resembled those of the healthy volunteers. Quantitative analysis with support vector machine (SVM) showed healthy volunteers and all patients with liver fibrosis (F1-4) were differentiated with a plane defined by (448.43*PF) +(0*Dslow) +(1*Dfast) −38.91=0.


The correlations of PF, Dfast and Dslow are graphically demonstrated in Figure 6. Figure 6A shows most of the PF measurements smaller than 1 were associated with Dfast smaller than 1, and vice versa. The lowest PF measurement was associated with the lowest Dfast measurement, and highest three PF measurements were associated with the highest three Dfast measurements. On the other hand, Figure 6B and C show the associations between Dslow vs. PF or between Dslow vs. Dfast were scattered. A number of Dslow measurements larger than 1 were associated with PF or Dfast measurements smaller than 1. Pearson correlation coefficient r was 0.865 (P<0.001) for PF vs. Dfast, 0.288 (P=0.28) for Dslow vs. PF, and 0.36 (P=0.17) for Dslow and Dfast (Figure 6D,E,F).

Discussion
Currently there is no established non-invasive diagnostic method to detect and grade early stage liver fibrosis (24). The most clinically used imaging technique for evaluation of liver fibrosis is ultrasound elastography, while the investigational technique of MR elastography has undergone many promising clinical trials (25-30). As IVIM imaging sequence is widely available in clinical MR scanners and there is no need for external device, it represents a convenient alternative to existing techniques for liver fibrosis evaluation. In our earlier study with 16 healthy volunteers and 33 hepatitis-b liver fibrosis patients (among them 15 cases were stage-1 liver fibrosis patients), we demonstrated that a combination of PF, Dslow and Dfast can be used to separate fibrotic livers completely from healthy livers with (15,16). Our this study, using a new set of healthy volunteers (n=26) and patients’ data (n=16), provides a confirmation of our previous report (15).
The value of IVIM parameters depend on the number and distribution of b-value series, as well as the threshold b-value when segmented fitting is applied (31-33). Moreover, it has been noted that the dependence of PF, Dslow, and Dfast on threshold b-value differs between healthy livers and fibrotic livers, with the healthy livers showing a higher degree of dependence (23). Since we used b=15 s/mm2, instead of b=0 s/mm2, as the first point for curve fitting, the PF and Dfast measurements were substantially lower than many other reports which included b=0 s/mm2 image (14). Owing to the first b-value for curve fitting was 15 s/mm2 instead of 10 s/mm2 as in our last study, the healthy volunteers’ PF, Dfast and Dslow values were even smaller for this study than our last study [when threshold b-value =60 s/mm2: PF =0.109±0.017, Dfast =19.15±3.67 [×10-3 mm2/s, and Dslow =1.28±0.22(×10-3 mm2/s)] (23). To improve the data acquisition protocol of our previous study (15), in this study we used 12 instead of 10 b-values, mainly we added two intermediate b-values of 30 and 50 s/mm2. This might have increased the fitting stability as demonstrated by the smaller CoV for healthy volunteers’ IVIM measurements if we take the assumption that IVIM measurement variations among the healthy volunteers are more likely being due to measurement imprecision rather genuine physiological difference among the volunteers. For the first ROI-based measurement, the CoVs for healthy subjects in our current study were 0.14, 0.17, 0.09, for PF, Dfast, and Dslow respectively (threshold b=60 s/mm2), slightly better as compared with the CoVs for healthy subjects of 0.16, 0.19, 0.17 for b=60 s/mm2 in our previous study [computed from Table 1 of reference (19), only one time ROI-based measurement] (15). We have also recently reported better scan-rescan repeatability and scan-rescan reproducibility for both PF and Dslow when b=50 or 80 s/mm2 was used as the threshold compared with when b=200 s/mm2 was used as the threshold (19). The same as our last study (15), among the three IVIM parameters, PF also showed best diagnostic performance in this study. According to previous estimation, Dfast should be the most sensitive parameter for liver fibrosis evaluation (14,15,23); however, precise measurement of Dfast is difficult and this current study did not include sufficient very low b-values for precise Dfast quantification (33,34). More b-values and applying an optimized b-value distribution shall be able to reduce errors in IVIM parameter estimation.
One of the intriguing findings is that both our current study and our previous study (15), which both demonstrated IVIM diffusion imaging’s high performance for detecting early liver fibrosis, did not use image of b=0 s/mm2. As demonstrated in Figure S3, the signal difference between b=0 s/mm2 image and b=1 or 2 s/mm2 images can be dramatic, particularly the vessels show high signal without diffusion gradient while show dark signal when the diffusion gradient is on even at b=1 s/mm2. This is likely to cause fitting instability. When we included b=0 s/mm2 image for curve fitting, it led to large measurement variations among healthy subjects (large CoV), and patients’ measurements partially overlapped with the healthy subjects’ results, thus the data of these two groups could not be completely separated. By using b=15 s/mm2 image as the starting point for curve fitting, we reduced the measurement variations among healthy subjects (smaller CoV), and thereby allowed healthy volunteers patients results and fibrosis results to be separated. The combination of our these two studies may suggest the appropriateness to analyze IVIM data without b=0 s/mm2 image. Whether to densely sample very low b-values (such as many b-values below 10 s/mm2) will allow more precise fitting of very fast motion compartments require further studies (33).

Another interesting observation of our study is that the IVIM measures of the three patients of chronic viral hepatitis-b without fibrosis and one patient with simple steatosis resembled those of the healthy volunteers. Though the number of these patients was very small, our results tentatively suggest that while pathological process of fibrosis can drive down the liver blood perfusion (as shown with decreased Dfast and PF), mere chronic viral hepatitis-b without fibrosis could have normal liver blood perfusion as well as diffusion.
The segmented fitting analysis remains the most commonly used method for liver IVIM diffusion analysis, and a b-value of 200 s/mm2 has been commonly selected as the threshold value as perfusion component’s influence on signal decay can be neglected for b-values ≥200 s/mm2 (14). The optimal threshold b-value for liver IVIM analysis remain undecided. In our recent report it was empirically demonstrated that compared with the commonly used threshold b-value of 200 s/mm2, a b-value of 60 s/mm2 increases the mean distance between healthy liver datapoints cluster and fibrotic liver datapoints cluster (23). This study, using a new set of healthy volunteers and patients’ data, confirmed the superiority of using threshold b-value =60 s/mm2 instead of threshold b-value =200 s/mm2 for detecting liver fibrosis.
Conceptionally, PF and Dfast are closely correlated. Despite the potential measurement imperfection, our results indeed confirmed this point with a high Pearson correlation coefficient r of 0.865 (P<0.001). On the other hand, the preliminary results in this study showed, for early and intermediate stage liver fibrosis, the correlation between slow diffusion compartment (Dslow) and fast diffusion compartment (PF and Dfast) were not statistically significant. Though for the 12 patients of the current study, PF alone provides sufficient separation between healthy subjects and patients, it is expected analysis incorporating all three IVIM parameters would be useful for marginal cases (15) (Table S2).
This study demonstrated good ROI measure-remeasure reproducibility with the same reader, with ICC of 0.925 for PF, 0.949 for Dfast, and 0.909 for Dslow respectively. However, Tables 1,2 show notable difference for a few individual’s measure-remeasure results. ICC can be deceivingly high when the range of the measurements is wide as it was the case for the IVIM parameters in this study. Diffusion imaging has several limitations, mostly attributable to the EPI (echo planar imaging) based nature of the sequence. EPI diffusion images are commonly associated with low signal-to-noise ratio and is susceptible to a number of artifacts, including blurring, ghosting and distortions. Uniform fat suppression is also a challenge. Despite respiration gating, the liver has physiological motion during the whole respirational cycle; therefore motion (liver position displacement) is inevitable between images of different b-values (14). Thus it is generally perceived that ROI drawing is a subjective process, and intra-reader/inter-reader difference would be expected. Performing multiple measurements and taking the mean value may be one approach to partially overcome the subjectivity associated with the ROI placement. Approaches to develop reliable and reproducible automatic ROI drawing will be of high value.
This study has some limitations. The patient number remains small. We started this study by initially scanning 10 healthy volunteers, then before the closure of this study we tried to compensate the small patient number by recruiting 16 more healthy volunteers. To our satisfaction, during the course of this study, the newly recruited healthy volunteers’ IVIM measurement all fell within the data cluster of the other existing healthy volunteers. While the combination of this study’s results and our previous results (15) can increase our confidence for detecting liver fibrosis by IVIM diffusion imaging, the results for the three patients of chronic viral hepatitis-b without fibrosis require further validations. Another limitation is that all our patients had liver fibrosis due to viral hepatitis-b. Whether results of our study can be generalized to liver fibrosis of other causes, such as NASH, remains to be validated. Prevalence of NAFLD is expected to rise given the high prevalence of obesity and type-2 diabetes worldwide (35). It has been noted that liver fibrosis is the single most important factor that determines long-term outcome in NAFLD patients (36). The detection of liver fibrosis in NAFLD is of high clinical importance. One more limitation of the study is that our volunteers were on average younger than the patients. Certainly, the b-value distribution in this study is not ideal, at this stage we would think that adding very low b-values such as 3, 5, 8 10 s/mm2 etc would be valuable for better quantification of both Dfast and PF (33,34). With IVIM imaging protocol of more very low b-values and better image post-procession, diagnosis of early stage fibrotic liver is likely to have increased reliability. Other approaches for improved data post-processing may include motion correction, de-noising as well as better segmentation to statistically remove ill-fitted pixels prior to ROI analysis, and employ better fitting strategies (33). It is also likely that a multi-parametric approach will have even better accuracy for evaluating the spectrum of chronic liver disease (37-39). The use of Bayesian prediction, incorporating relevant findings from the available methods, is also a promising approach (40). The Bayesian prediction provides probabilities and allow weighting of the different methods, such as IVIM (14,15), liver T1/T2 relaxivity (38,41,42), T1rho (43-47) and elastography (28-30) readouts, therefore realizing multi-parameter diagnosis.
In conclusion, this study confirmed our previous report that IVIM diffusion MR imaging can detect early stage liver fibrosis; and when the low b-value data sampled is insufficient, discarding the image of b=0 s/mm2 for bi-exponential segmented fitting may improve fitting stability. For the b-value distribution used in this study, a threshold b-value of 60 s/mm2 is strongly preferred over a threshold b of 200 s/mm2. We acknowledge that the findings in this study require further validation.
Acknowledgements
Funding: This work was partially supported by the Sanming Project of Medicine in Shenzhen (SZSM201612053).
Footnote
Conflicts of Interest: The authors have no conflicts of interest to declare.
Ethical Statement: The study protocol was approved by the Ethics Committee of the Third People’s Hospital of Shenzhen (No. 2016-006), with written informed consent obtained for all participants.
References
- Collaborators GMaCoD. Global, regional, and national life expectancy, all-cause mortality, and cause-specific mortality for 249 causes of death, 1980-2015: a systematic analysis for the Global Burden of Disease Study 2015. Lancet 2016;388:1459-544. [Crossref] [PubMed]
- Martinez SM, Foucher J, Combis JM, et al. Longitudinal liver stiffness assessment in patients with chronic hepatitis C undergoing antiviral therapy. PLoS One 2012;7:e47715. [Crossref] [PubMed]
- Marcellin P, Gane E, Buti M, et al. Regression of cirrhosis during treatment with tenofovir disoproxil fumarate for chronic hepatitis B: a 5-year open-label follow-up study. Lancet. 2013;381:468-75. [Crossref] [PubMed]
- Campana L, Iredale JP. Regression of liver fibrosis. Semin Liver Dis 2017;37:1-10. [Crossref] [PubMed]
- Le Bihan D, Breton E, Lallemand D, et al. MR imaging of Intravoxel Incoherent Motions: Application to Diffusion and Perfusion in Neurologic Disorders. Radiology 1986;161:401-7. [Crossref] [PubMed]
- Le Bihan D, Breton E, Lallemand D, et al. Separation of Diffusion and Perfusion in Intravoxel Incoherent Motion MR imaging. Radiology 1988;168:497-505. [Crossref] [PubMed]
- Le Biha D, Turner R. The Capillary Network: A Link between IVIM and Classical Perfusion. Magn Reson Med 1992;27:171-8. [Crossref] [PubMed]
- Le Bihan D, Turner R, Moonen CT, et al. Imaging of Diffusion and Microcirculation with Gradient Sensitization: Design, Strategy, and Significance. J Magn Reson Imaging 1991;1:7-28. [Crossref] [PubMed]
- Greenway CV, Stark RD. Hepatic Vascular Bed. Physiol Rev 1971;51:23-65. [Crossref] [PubMed]
- Moreno AH, Burchell AR, Rousselot LM, et al. Portal Blood Flow in Cirrhosis of the Liver. J Clin Invest 1967;46:436-45. [Crossref] [PubMed]
- Iwakiri Y, Groszmann RJ. The Hyperdynamic Circulation of Chronic Liver Diseases: from the Patient to the Molecule. Hepatology 2006;43:S121-31. [Crossref] [PubMed]
- Van Beers BE, Leconte I, Materne R, et al. Hepatic Perfusion Parameters in Chronic Liver Disease: Dynamic CT Measurements Correlated with Disease Severity. AJR Am J Roentgenol 2001;176:667-73. [Crossref] [PubMed]
- Blendis L, Wong F. The Hyperdynamic Circulation in Cirrhosis: An Overview. Pharmacol Ther 2001;89:221-31. [Crossref] [PubMed]
- Li YT, Cercueil JP, Yuan J, et al. Liver intravoxel incoherent motion (IVIM) magnetic resonance imaging: a comprehensive review of published data on normal values and applications for fibrosis and tumor evaluation. Quant Imaging Med Surg 2017;7:59-78. [Crossref] [PubMed]
- Wáng YX, Deng M, Li YT, et al. A Combined Use of Intravoxel Incoherent Motion MRI Parameters Can Differentiate Early-Stage Hepatitis-b Fibrotic Livers from Healthy Livers. SLAS Technol 2018;23:259-68. [Crossref] [PubMed]
- Cercueil JP. A combined use of intravoxel incoherent motion MRI parameters can differentiate early-stage hepatitis-b fibrotic livers from healthy livers Ann Transl Med 2017;5:410. [Crossref] [PubMed]
- Branch Association of Infectious Diseases and Parasitic Epidemiology. Branch Association of Hepatology. Chinese Medical Association. Virus Hepatitis Integrated Control Measure. Chin J Infect Dis 2001;19:56-62.
- Bedossa P, Poynard T. An Algorithm for the Grading of Activity in Chronic Hepatitis C. The METAVIR Cooperative Study Group. Hepatology 1996;24:289-93. [Crossref] [PubMed]
- Chevallier O, Zhou N, He J, et al. Removal of evidential motion-contaminated and poorly fitted image data improves IVIM diffusion MRI parameter scan-rescan reproducibility. Acta Radiol 2018;59:1157-67. [Crossref] [PubMed]
- Yuan J, Wong OL, Lo GG, et al. Statistical assessment of bi-exponential diffusion weighted imaging signal characteristics induced by intravoxel incoherent motion in malignant breast tumors. Quant Imaging Med Surg 2016;6:418-29. [Crossref] [PubMed]
- Li YT, Huang H, Zhuo Z, et al. Bi-phase age-related brain gray matter magnetic resonance T1r relaxation time change in adults. Magn Reson Imaging 2017;39:200-5. [Crossref] [PubMed]
- Lu PX, Huang H, Yuan J, et al. Decreases in Molecular Diffusion, Perfusion Fraction and Perfusion-related Diffusion in Fibrotic Livers: A Prospective Clinical Intravoxel Incoherent Motion MR Imaging Study. PLoS One 2014;9:e113846. [Crossref] [PubMed]
- Wáng YX, Li YT, Chevallier O, et al. Dependence of intravoxel incoherent motion diffusion MR threshold b-value selection for separating perfusion and diffusion compartments and liver fibrosis diagnostic performance. Acta Radiol 2019;60:3-12. [Crossref] [PubMed]
- Patel K, Shackel NA. Current Status of Fibrosis Markers. Curr. Opin. Gastroenterol 2014;30:253-9. [Crossref] [PubMed]
- Petitclerc L, Sebastiani G, Gilbert G, et al. Liver Fibrosis: Review of Current Imaging and MRI Quantification Techniques. J Magn Reson Imaging 2017;45:1276-95. [Crossref] [PubMed]
- Bota S, Herkner H, Sporea I, et al. Meta-analysis: ARFI Elastography versus Transient Elastography for the Evaluation of Liver Fibrosis. Liver Int 2013;33:1138-47. [Crossref] [PubMed]
- Friedrich-Rust M, Nierhoff J, Lupsor M, et al. Performance of Acoustic Radiation Force Impulse Imaging for the Staging of Liver Fibrosis: A Pooled Meta-analysis. J Viral Hepat 2012;19:e212-9. [Crossref] [PubMed]
- Singh S, Venkatesh SK, Wang Z, et al. Diagnostic Performance of Magnetic Resonance Elastography in Staging Liver Fibrosis: A Systematic Review and Meta-Analysis of Individual Participant Data. Clin Gastroenterol Hepatol 2015;13:440-51.e6. [Crossref] [PubMed]
- Guo Y, Parthasarathy S, Goyal P, et al. Magnetic Resonance Elastography and Acoustic Radiation Force Impulse for Staging Hepatic Fibrosis: A Meta-Analysis. Abdom Imaging 2015;40:818-34. [Crossref] [PubMed]
- Singh S, Venkatesh SK, Loomba R, et al. Magnetic Resonance Elastography for Staging Liver Fibrosis in Non- Alcoholic Fatty Liver Disease: A Diagnostic Accuracy Systematic Review and Individual Participant Data Pooled Analysis. Eur Radiol 2016;26:1431-40. [Crossref] [PubMed]
- ter Voert EE, Delso G, Porto M, et al. Intravoxel Incoherent Motion Protocol Evaluation and Data Quality in Normal and Malignant Liver Tissue and Comparison to the Literature. Invest Radiol 2016;51:90-9. [Crossref] [PubMed]
- Wurnig M C, Donati OF, Ulbrich E, et al. Systematic Analysis of the Intravoxel Incoherent Motion Threshold Separating Perfusion and Diffusion Effects: Proposal of a Standardized Algorithm. Magn Reson Med 2015;74:1414-22. [Crossref] [PubMed]
- Chevallier O, Zhou N, Cercueil JP, et al. Comparison of tri-exponential decay vs. bi-exponential decay and full fitting vs. segmented fitting for modeling liver intravoxel incoherent motion diffusion MRI. bioRxiv 2018; Available online: http://dx.doi.org/. [Crossref]
- Zhang Q, Wang YX, Ma HT, et al. Cramér-Rao bound for Intravoxel Incoherent Motion Diffusion Weighted Imaging Fitting. Conf Proc IEEE Eng Med Biol Soc 2013;2013:511-4. [PubMed]
- Younossi ZM, Koenig AB, Abdelatif D, et al. Global epidemiology of nonalcoholic fatty liver disease: metanalytic assessment of prevalence, incidence, and outcomes. Hepatology 2016;64:73-84. [Crossref] [PubMed]
- Angulo P, Kleiner DE, Dam-Larsen S, et al. Liver fibrosis, but no other histologic features, is associated with long-term outcomes of patients with nonalcoholic fatty liver disease. Gastroenterology 2015;149:389-97.e10. [Crossref] [PubMed]
- Feier D, Balassy C, Bastati N, et al. The diagnostic efficacy of quantitative liver MR imaging with diffusion-weighted, SWI, and hepato-specific contrast-enhanced sequences in staging liver fibrosis—a multiparametric approach. Eur Radiol 2016;26:539-46. [Crossref] [PubMed]
- Banerjee R, Pavlides M, Tunnicliffe EM, et al. Multiparametric magnetic resonance for the noninvasive diagnosis of liver disease. J Hepatol 2014;60:69-77. [Crossref] [PubMed]
- Pavlides M, Banerjee R, Sellwood J, et al. Multiparametric magnetic resonance imaging predicts clinical outcomes in patients with chronic liver disease. J Hepatol 2016;64:308-15. [Crossref] [PubMed]
- Motosugi U, Ichikawa T, Araki T, et al. Bayesian Prediction for Liver Fibrosis Staging: Combined Use of Elastography and Serum Fibrosis Markers. Hepatology 2013;58:450-1. [Crossref] [PubMed]
- Pavlides M, Banerjee R, Tunnicliffe EM, et al. Multiparametric magnetic resonance imaging for the assessment of non-alcoholic fatty liver disease severity. Liver Int 2017;37:1065-73. [Crossref] [PubMed]
- Guimaraes AR, Siqueira L, Uppal R, et al. T2 relaxation time is related to liver fibrosis severity. Quant Imaging Med Surg 2016;6:103-14. [Crossref] [PubMed]
- Allkemper T, Sagmeister F, Cicinnati V, et al. Evaluation of fibrotic liver disease with whole-liver T1ρ MR imaging: a feasibility study at 1.5 T. Radiology 2014;271:408-15. [Crossref] [PubMed]
- Koon CM, Zhang X, Chen W, et al. Black blood T1rho MR imaging may diagnose early stage liver fibrosis: a proof-of-principle study with rat biliary duct ligation model. Quant Imaging Med Surg 2016;6:353-63. [Crossref] [PubMed]
- Wáng YX, Chen W, Deng M. How liver pathologies contribute to T1rho contrast require more careful studies. Quant Imaging Med Surg 2017;7:608-13. [Crossref] [PubMed]
- Xie S, Li Q, Cheng Y, et al. Impact of Liver Fibrosis and Fatty Liver on T1rho Measurements: A Prospective Study. Korean J Radiol 2017;18:898-905. [Crossref] [PubMed]
- Wáng YX, Deng M, Lin J, et al. Age- and Gender-Associated Liver Physiological T1rho Dynamics Demonstrated with a Clinically Applicable Single-Breathhold Acquisition. SLAS Technol 2018;23:179-87. [Crossref] [PubMed]

